
The Flow of Energy Through Ecosystems PowerPoint PPT Presentation
1 / 50
Title: The Flow of Energy Through Ecosystems
1
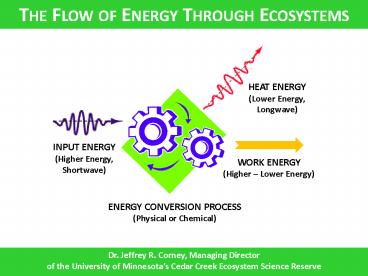
The Flow of Energy Through Ecosystems
Dr. Jeffrey R. Corney, Managing Director of the
University of Minnesotas Cedar Creek Ecosystem
Science Reserve
2
Global Net Primary Productivity
3
Key to Productivity Energy Water
(and Nutrients)
4
Eco-Regions of Earth
5
Total Global Net Productivity
6
Global Net Productivity per Unit Area
7
THE BIG IDEA Solar Energy
Builds Organisms, Powers Life Functions, and
Drives Earths Water, Carbon, Oxygen Nutrient
Cycles
8
Food Chain vs. Food Web
9
Trophic Levels
10
Trophic Levels as Food Web
11
Trophic Level Pyramids
12
Trophic Pyramid to Eltonian Energy Transfer
Pyramid
The starting point is PHOTOSYNTHESIS
13
Energy Flow
Photosynthesis Cellular Level
14
Energy Flow
Photosynthesis in Chloroplasts
15
Energy Flow
Site of Photosynthesis Chlorophyll
16
Energy Flow
The Calvin Cycle
17
Energy Flow
Product of Photosynthesis
18
Energy Flow
Transfer of Energy from Sun to Cell
From here
to here!
19
Energy Flow
Biological Energy Storage Release
20
Conversion of Photon Energy to Work
21
Where It All Begins
NOTE 1 Watt 1 Joule/second 1 Joule 0.00024
kcal 1kcal 1 Calorie
The Sun Radiates 63,000,000 W/m2 of Energy from
Its Surface into Space
22
Then, On to Earth (93 Million Miles in about 8
Minutes)
1,367 W/m2 or 0.002 of the Suns Total Energy
Output Reaches Earths Orbit
23
Earths Sphere Intercepting Energy
343 W/m2 or 0.0005 of the Suns Total Energy
Output Enters Earths Atmosphere
24
Earths Gross Solar Insolation
25
Earths Energy Budget
175 W/m2 or 0.00025 of the Suns Total Energy
Output Is Absorbed by Earths Surface
26
Energy Flow
Solar Spectrum Reaching Earth
27
Net Solar Insolation at Surface
28
Energy Flow
Photosynthetically Active Radiation (PAR)
29
Cross-Section of Energy for 1-m2 (4-month Summer
Growing Season)
30
Energy Flow Into an Ecosystem
31
Energy Flow Through an Ecosystem
32
Energy Flow Through a Trophic Level
33
Primary Productivity
Gross Primary Productivity (GPP) uses available
(PAR) Solar Energy, Water, and Carbon Dioxide to
produce Glucose Range 0.01 - 5 of PAR (2.5
average) 0.00000005 of Total Solar Output
Net Primary Productivity (NPP) Glucose
produced during photosynthesis (GPP) Glucose
used during plant Respiration (R) Range 20
60 of GPP (40 average)
34
Secondary Productivity
GSP ranges from 20 to 90 of Incoming Food Energy
NSP ranges from 1 to 40 of Incoming Food Energy
35
Efficiency of Energy Transfer
INGESTION EFFICIENCY Energy Consumed as
Food Herbivores 5 - 50 (25
average) Carnivores 25 - 100 (60
average) ASSIMILATION EFFICIENCY Energy
Digested Absorbed (- feces) Herbivores 20 -
50 (30 average) Carnivores 70 - 90 (80
average) PRODUCTION EFFICIENCY Energy Used to
Grow Biomass Invertebrates 30 - 40 (35
average) Vertebrates Ectotherms 5 - 15 (10
average) Vertebrates Endotherms 1 - 2 (1.5
average)
TROPHIC-LEVEL ENERGY TRANSFER EFFICIENCY
Available for Next Consumer Trophic-Level Energy
Transfers 2 - 24 (10 average) gt The 10
Rule
36
Energy Transfer Eltonian Pyramid
0.010 of GPP available
Tertiary Consumers
0.0025 of PAR
Secondary Consumers
0.10 of GPP available
0.025 of PAR
Primary Consumers
0.25 of PAR
10 of GPP available
Net Primary Productivity (NPP) 1.0 of PAR or
40 of GPP
Primary Producers
Gross Primary Productivity (GPP) 2.5 of PAR
Solar Energy Available for Photosynthesis (PAR)
100 Photosynthetically Active Radiation
(PAR) 40 of Net Surface Solar Insolation
J. Corney
37
Example from Actual Temperate Forest
38
Example from a Sub-tropical Ecosystem
39
Examples from Other Ecosystems
40
Examples of Actual Efficiencies
41
Then Theres the Carbon Cycle
42
Carbon Cycling Through an Ecosystem
43
Energy Flow Carbon Cycling
44
Nitrogen Cycle Linked to Carbon Cycle
WHATS GOING ON IN THE SOIL?
45
(No Transcript)
46
Trophic-Level Energy Transfer Eltonian Pyramid
47
(No Transcript)
48
(No Transcript)
49
(No Transcript)
50
(No Transcript)
Recommended
