
Warm Up PowerPoint PPT Presentation
Title: Warm Up
1
Radical Functions
8-7
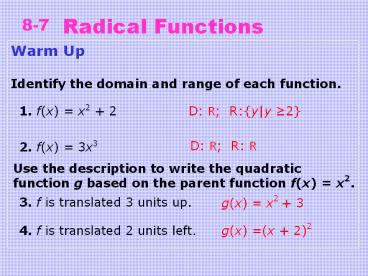
Warm Up Identify the domain and range of each
function.
D R Ryy 2
1. f(x) x2 2
D R R R
2. f(x) 3x3
Use the description to write the quadratic
function g based on the parent function f(x)
x2.
3. f is translated 3 units up.
g(x) x2 3
g(x) (x 2)2
4. f is translated 2 units left.
2
Objectives
Graph radical functions and inequalities. Transfo
rm radical functions by changing parameters.
Vocabulary
radical function square-root function
3
Recall that exponential and logarithmic functions
are inverse functions. Quadratic and
cubic functions have inverses as well. The graphs
below show the inverses of the quadratic parent
function and cubic parent function.
4
Notice that the inverses of f(x) x2 is not a
function because it fails the vertical line test.
However, if we limit the domain of f(x) x2 to x
0, its inverse is the function .
5
Example 1A Graphing Radical Functions
Graph each function and identify its domain and
range.
Make a table of values. Plot enough ordered pairs
to see the shape of the curve. Because the square
root of a negative number is imaginary, choose
only nonnegative values for x 3.
6
Example 1A Continued
x (x, f(x))
3 (3, 0)
4 (4, 1)
7 (7, 2)
12 (12, 3)
?
?
?
?
The domain is xx 3, and the range is yy
0.
7
Example 1B Graphing Radical Functions
Graph each function and identify its domain and
range.
Make a table of values. Plot enough ordered pairs
to see the shape of the curve. Choose both
negative and positive values for x.
8
Example 1B Continued
x (x, f(x))
6 (6, 4)
1 (1,2)
2 (2, 0)
3 (3, 2)
10 (10, 4)
?
?
?
?
?
The domain is the set of all real numbers. The
range is also the set of all real numbers
9
Check It Out! Example 1a
Graph each function and identify its domain and
range.
Make a table of values. Plot enough ordered pairs
to see the shape of the curve. Choose both
negative and positive values for x.
10
Check It Out! Example 1a Continued
x (x, f(x))
8 (8, 2)
1 (1,1)
0 (0, 0)
1 (1, 1)
8 (8, 2)
The domain is the set of all real numbers. The
range is also the set of all real numbers.
11
Check It Out! Example 1b
Graph each function, and identify its domain and
range.
x (x, f(x))
1 (1, 0)
3 (3, 2)
8 (8, 3)
15 (15, 4)
The domain is xx 1, and the range is yy
0.
12
(No Transcript)
13
Example 2 Transforming Square-Root Functions
Using the graph of as a guide,
describe the transformation and graph the
function.
f(x) x
Translate f 5 units up.
14
Check It Out! Example 2a
Using the graph of as a guide,
describe the transformation and graph the
function.
f(x) x
Translate f 1 unit up.
15
Check It Out! Example 2b
Using the graph of as a guide,
describe the transformation and graph the
function.
f(x) x
16
Transformations of square-root functions are
summarized below.
17
Example 3 Applying Multiple Transformations
Using the graph of as a guide,
describe the transformation and graph the
function
f(x) x
.
Reflect f across the x-axis, and translate it 4
units to the right.
18
Check It Out! Example 3a
Using the graph of as a guide,
describe the transformation and graph the
function.
f(x) x
g is f reflected across the y-axis and translated
3 units up.
19
Check It Out! Example 3b
Using the graph of as a guide,
describe the transformation and graph the
function.
f(x) x
g is f vertically stretched by a factor of 3,
reflected across the x-axis, and translated 1
unit down.
20
Example 4 Writing Transformed Square-Root
Functions
Use the description to write the square-root
function g. The parent function is
reflected across the x-axis, compressed
vertically by a factor of , and translated
down 5 units.
f(x) x
Step 1 Identify how each transformation affects
the function.
Reflection across the x-axis a is negative
Translation 5 units down k 5
21
Example 4 Continued
Step 2 Write the transformed function.
Simplify.
22
Check It Out! Example 4
Use the description to write the square-root
function g.
The parent function is reflected
across the x-axis, stretched vertically by a
factor of 2, and translated 1 unit up.
f(x) x
Step 1 Identify how each transformation affects
the function.
Reflection across the x-axis a is negative
a 2
Vertical compression by a factor of 2
Translation 5 units down k 1
23
Check It Out! Example 4 Continued
Step 2 Write the transformed function.
Substitute 2 for a and 1 for k.
Simplify.
24
In addition to graphing radical functions, you
can also graph radical inequalities. Use the same
procedure you used for graphing linear and
quadratic inequalities.
25
Example 6 Graphing Radical Inequalities
Graph the inequality .
x 0 1 4 9
y 3 1 1 3
26
Example 6 Continued
Step 2 Use the table to graph the boundary
curve. The inequality sign is gt, so use a dashed
curve and shade the area above it.
Because the value of x cannot be negative, do not
shade left of the y-axis.
27
Example 6 Continued
Check Choose a point in the solution region,
such as (1, 0), and test it in the inequality.
0 gt 2(1) 3
0 gt 1
?
28
Check It Out! Example 6a
Graph the inequality.
x 4 3 0 5
y 0 1 2 3
29
Check It Out! Example 6a Continued
Step 2 Use the table to graph the boundary
curve. The inequality sign is gt, so use a dashed
curve and shade the area above it.
Because the value of x cannot be less than 4, do
not shade left of 4.
30
Check It Out! Example 6a Continued
Check Choose a point in the solution region,
such as (0, 4), and test it in the inequality.
4 gt (0) 4
4 gt 2
?
31
Check It Out! Example 6b
Graph the inequality.
x 4 3 0 5
y 0 1 2 3
32
Check It Out! Example 6b Continued
Step 2 Use the table to graph the boundary
curve. The inequality sign is gt, so use a dashed
curve and shade the area above it.
33
Check It Out! Example 6b Continued
Check Choose a point in the solution region,
such as (4, 2), and test it in the inequality.
2 1
?
34
Lesson Quiz Part I
Dxx 4 Ryy 0
35
Lesson Quiz Part II
2. Using the graph of as a guide,
describe the transformation and graph the
function .
g(x) -x 3
g is f reflected across the y-axis and translated
3 units up.
36
Lesson Quiz Part III
3. Graph the inequality .
Recommended
