
Dimensionality Reduction for fMRI Brain Imaging Data PowerPoint PPT Presentation
Title: Dimensionality Reduction for fMRI Brain Imaging Data
1
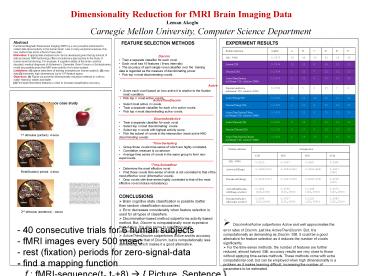
Dimensionality Reduction for fMRI Brain Imaging
Data
Leman Akoglu Carnegie Mellon
University, Computer Science Department
Abstract Functional Magnetic Resonance Imaging
(fMRI) is a very powerful instrument to collect
data about activity in the human brain. Like in
many empirical sciences, this new method has led
to a flood of new data. Motivation If
appropriate analysis tools can be developed given
the big amount of data produced, fMRI technology
offers revolutionary approaches to the study of
human brain functioning. For example, if
cognitive states of the brain could be decoded,
medical diagnosis of Alzheimers, Dementia, Brain
Tumors or Schizophrenia would be possible given
the fMRI brain activity of a human
subject. Limitations (1) sparse data (tens of
training examples per human subject), (2) noisy
data (3) extremely high dimensional (up to 105)
feature space. Objectives (1) Figure out
powerful dimensionality reduction methods in
order to make learning easier and faster. (2)
Find best informative features in order to
increase classification accuracy.
- FEATURE SELECTION METHODS
- Discrim
- Train a separate classifier for each voxel.
- Each voxel has 16 features ( 8-sec intervals)
- The accuracy of each single-voxel classifier
over the training data is regarded as
the measure of discriminating power. - Pick top n most discriminating voxels.
EXPERIMENT RESULTS
Feature selection AvgErr A B C D E F
All (5000) 0.3979 16 46 26 41 34 28
Active(120) 0.2146 12 33 8 24 13 13
Discrim(120) 0.1604 1 23 7 22 11 13
ActiveThenDiscrim (nToKeep120, nActive2000) 0.1479 1 21 6 23 10 10
DiscrimAndActive (nDiscrim120, nActive2000) 0.0792 1 5 2 17 7 6
ActiveTSavg(240) 0.2063 10 31 10 22 12 14
DiscrimTSavg(120) 0.1625 1 21 6 23 12 15
ActiveThenDiscrimTSavg (nToKeep120, nActive2000) 0.1479 0 21 6 23 11 10
ActiveTSmost(120) 0.2021 9 34 7 23 11 13
DiscrimTSmost(120) 0.1792 0 17 9 30 17 13
ActiveThenDiscrimTSmost (nToKeep120, nActive2000) 0.1458 1 16 10 20 12 11
- Active
- Score each voxel based on how active it is
relative to the fixation - (rest) condition.
- Pick top n most active voxels.
Picture versus Sentence case study
-
ActiveThenDiscrim - Select most active m voxels.
- Train a separate classifier for each of m active
voxels. - Pick top n most discriminating active voxels.
-
DiscrimAndActive - Train a separate classifier for each voxel.
- Select top n most discriminating voxels.
- Select top n voxels with highest activity score.
- Pick the subset of voxels in the intersection
(most active AND discriminating voxels)
1st stimulus (picture) 4 secs
-
Time-SeriesAvg - Group those voxels time-series of which are
highly correlated. - Correlation measure is covariance.
- Average time series of voxels in the same group
to form new supervoxels.
Feature selection Average error Average error Average error Average error
Feature selection 1NN 3NN 9NN SVM
0.4125 0.3937 0.3625 0.2687
Active (nToKeep) 0.2896(120) 0.2854(240) 0.3000(480) 0.0917 (240)
Discrim (nToKeep) 0.3104(120) 0.2417(120) 0.2042(120) 0.0208 (120)
ActiveThenDiscrim (nToKeep, nActive) 0.2854 (240,1000) 0.2562 (120,1000) 0.2146 (120,2000) 0.0271 (120,1000)
DiscrimAndActive (nDiscrim, nActive) 0.2604 (120,2000) 0.2917 (120,3000) 0.2125 (120,3000) 0.0583 (120,3000)
All (5000)
-
Time-SeriesMost - Determine the most effective voxel.
- Find those voxels time-series of which is not
correlated to that of the most effective voxel
(informative voxels). - Drop voxels with time-series highly correlated
to that of the most effective voxel (reduce
redundancy).
Rest(fixation) period 4 secs
- CONCLUSIONS
- Brain cognitive state classification is possible
(better than random classification accuracies). - Error decreases considerably when feature
selection is used for all types of classifiers. - Discrimination-based method outperforms
activity-based method. But, Discrim is
computationally more expensive than Active. It is
also prone to overfitting as its performance is
evaluated on training data. - ActiveThenDiscrim outperforms Active and its
accuracy is very close to that of Discrim, but is
computationally less demanding, which makes it a
good alternative.
- DiscrimAndActive outperforms Active and well
approximates the error rates of Discrim, just
like ActiveThenDiscrim. But, it is
computationally as demanding as Discrim. Still,
it could be a good alternative for feature
selection as it reduces the number of voxels
significantly. - For the time-series methods, the number of
features are further reduced, almost halved.
Still, accuracy results are very close to those
without applying time-series methods. These
methods come with extra computational cost, but
can be employed when high dimensionality is a
problem as it makes learning difficult,
increasing the number of parameters to be
estimated.
2nd stimulus (sentence) 4secs
- 40 consecutive trials for 6 human subjects -
fMRI images every 500 msec - rest (fixation)
periods for zero-signal-data - find a mapping
function f fMRI-sequence(t0,t08) ?
Picture, Sentence
Recommended
