
Box and Whisker Plots 50% PowerPoint PPT Presentation
1 / 1
Title: Box and Whisker Plots 50%
1
Box and Whisker Plots 50
- 98 86 98 88 95 59 64 55 91 92
- 76 79 95 98 85 83 91 99 80 77
68
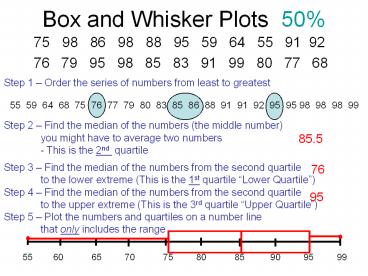
Step 1 Order the series of numbers from least
to greatest
55 59 64 68 75 76 77 79 80 83 85 86
88 91 91 92 95 95 98 98 98 99
Step 2 Find the median of the numbers (the
middle number) you might have to average two
numbers - This is the 2nd quartile
85.5
Step 3 Find the median of the numbers from the
second quartile to the lower extreme (This is
the 1st quartile Lower Quartile)
76
Step 4 Find the median of the numbers from the
second quartile to the upper extreme (This is
the 3rd quartile Upper Quartile)
95
Step 5 Plot the numbers and quartiles on a
number line that only includes the range
55 60 65 70 75
80 85 90 95
99
Recommended
