
48x36 Trifold Poster Template PowerPoint PPT Presentation
Title: 48x36 Trifold Poster Template
1
Elementary School Teachers Teaching,
Understanding and Using Statistics Anna E.
Bargagliotti1 Derek Webb2 1University of
Memphis, 2Bemidji State University
Overview
General Framework
- Data and data-driven decision-making are being
set as the gold-standard throughout business,
education, and policy - I am a deep believer in the power of data to
drive our decisions. Data gives us the road map
to reform. It tells us where we are, where we
need to go, and who is most at risk. Arnie
Duncan, 2009 - We find that firms that adopt data-driven
decision making have output and productivity that
is 5-6 higher than what would be expected.
Brynjolfsson, Hitt, Kim, 2011 - It is therefore crucial for us as educators to
consider how we can prepare a population that can
make sense of data, i.e., a statistically
literate population - Statistical literacy refers to the ability to
think and reason in the presence of uncertainty
On the Job Data
Interweaving factors related to elementary
teacher preparation in statistics
- Under the No Child Left Behind Act (NCLB, 2001),
all states have to produce an Annual Yearly
Progress (AYP) report - Every state, school system, and school is then in
turn issued a Report Card - The Report Card lists the subjects and the
assessments that are included in the evaluation
of the specific state - These reports contain an enormous amount of
statistical information - Teachers are expected to use these data to inform
their teaching - Here is a sample report card from the state of TN
On the Job Requirements
Student Learning
Policy Regulations
Common Core State Standards
Common Core
NCTM Standards
Student Learning
Comparison
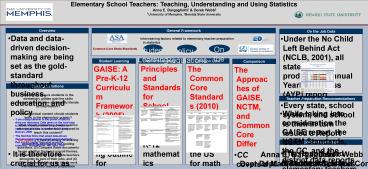
- Principles and Standards for School Mathematics
(2000) - Organizes K-12 mathematics content into five
content standards - Dedicates the standard Data Analysis and
Probability to statistical content - Decomposes Data Analysis and Probability strand
into four sub-standards that divided into
expectations for Pre-K-2 and 3-5 grade-band
- GAISE A Pre-K-12 Curriculum Framework (2005)
- Provides an overarching outline for statistics
education in K-12 - Defines a statistically literate person to be one
that can formulate questions, collect data,
analyze data, and interpret results - Presents a three-level framework (levels A, B,
and C) corresponding to the depth of coverage
within each component - Level A and B may be pertinent to elementary
grades
- The Common Core Standards (2010)
- Unify K-12 education across the US for math and
English Language Arts - Deemphasizes statistics in the elementary grades
- Introduces statistics in middle school and
continues through high school - Contains the strand Measurement and Data in the
elementary grades under which a few statistical
concepts are described
- The Approaches of GAISE, NCTM, and Common Core
Differ - CC covers a small subset of the concepts outlined
by GAISE - Main difference lies in the approach
- GAISE focuses on students overall statistical
literacy - CC focuses on ensuring that students can perform
specific tasks related to statistics - NCTM standards are much broader and all
encompassing than the other two documents - E.g., the first standard alone encompasses most
of the GAISE components - NCTM not as explicitly decomposed as GAISE
- NCTM standards set large broad goals for
statistical learning by listing a general set of
tasks - NCTM standards allude to having students explore
their own statistical thinking process
Guiding Questions
How do we ensure students in the elementary
grades gain the skills necessary to become
statistically literate as they mature? What
statistical content should students learn in the
elementary grades? What should elementary
teachers know about statistics in order to be
prepared to teach this content? Our Goals (1)
Take inventory of existing documents addressing
our guiding questions, (2) Compare these
documents to see whether there are overall
themes, (3) Shed light on the type of data
teachers encounter as part of their jobs, and (4)
Offer recommendations for future work with
elementary teacher preparation
Teacher Preparation Recommendations
- While taking into consideration the GAISE report,
the NCTM Standards, the CC, and the district data
reports, elementary teachers are required to
navigate through numerous statistical concepts
both in and outside the classroom - In light of the differences and similarities
found among the way these influential and
important documents approach statistics,
elementary school teachers must at the very least
- understand all of the tasks presented throughout
the documents - be aware of the different approaches and be
comfortable switching among the documents - have a general understanding of the process of
thinking statistically - understand how to use data to inform their
teaching
Contact Information
Derek Webb Dept. of Mathematics and Computer
Science Bemidji State University
Dwebb_at_bemidjistate.edu
Anna E. Bargagliotti Dept. of Mathematical
Sciences University of Memphis abargag_at_yahoo.com
Recommended
