
Graphing Trigonometry Functions PowerPoint PPT Presentation
Title: Graphing Trigonometry Functions
1
Graphing Trigonometry Functions
Basic Graphs
2
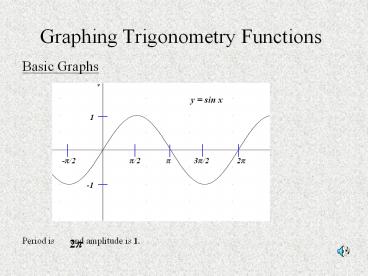
Graphing Trigonometry Functions
Basic Graphs
3
Special Angles and Graphs
4
Graphing Trig Functions
Amplitude Change
y a sin x stretches or compresses the graph
vertically
5
Graphing Trig Functions
Phase Shift
y sin(x - b) slides graph right by b units
6
Graphing Trig Functions
Phase Shift
y sin(x b) slides graph left by b units
7
Graphing Trig Functions
Period Change
y sin cx stretches or compresses the graph
horizontally
8
(No Transcript)
Recommended
