
Effects of Volcanic SO2 on Pulmonary Function PowerPoint PPT Presentation
1 / 24
Title: Effects of Volcanic SO2 on Pulmonary Function
1
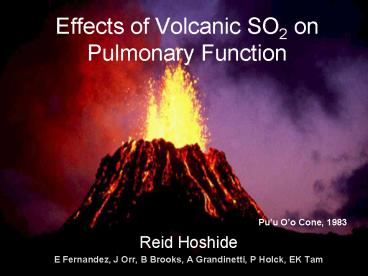
Effects of Volcanic SO2 on Pulmonary Function
Puu Oo Cone, 1983
- Reid Hoshide
- E Fernandez, J Orr, B Brooks, A Grandinetti, P
Holck, EK Tam
2
Introduction
- Major emissions are from Puu Oo vent and some
from Kilauea Crater. - These volcanic emissions are comprised mostly
of SO2, CO2, and H2O vapor. - Recent SO2 emissions can range from 300 tons per
day (at pause) to 6000 tons when the volcano is
active.
3
Dispersal of SO2
- Heavily dependent on wind patterns
- Predominantly tradewinds (from the northeast)
from May to October. - More frequent periods of Kona winds from the
south from November to April.
4
Previous research
- In animal studies, high concentrations of SO2
shows airway inflammation and hyperresponsiveness1
. - Studies on mild asthmatics that were introduced
to SO2 levels of 500 ppb increased airway
resistance when delivered in cold, dry air (4
degrees C and relative humidity 40) while
exercising2. - Epidemiological studies showed that sulfates
increased bronchitis, chronic cough, and chest
illness from man-made, fossil fuel sources3.
1Bethel RA, Erle DJ, Epstein J, Sheppard D, Nadel
JA, Boushey HA. Effect of exercise rate and route
of inhalation on sulfur-dioxide- induced
bronchoconstriction in asthmatic subjects. Am Rev
Respir Dis 1983128(4)592-6. 2Linn WS, Venet
TG, Shamoo DA, Valencia LM, Anzar UT, Spier CE,
et al. Respiratory effects of sulfur dioxide in
heavily exercising asthmatics. A dose-response
study. Am Rev Respir Dis 1983127(3)278-83. 3Doc
kery DW, Speizer FE, Stram DO, Ware JH, Spengler
JD, Ferris BG. Effects of inhalable particles on
respiratory health of children. Am Rev Respir Dis
1989139(3)587-94.
5
Puu Oo and Volcano Village
6
Volcano Village
- 2,231 Residents (2000 census).
- 4 miles north of Kilauea. 8 miles northeast of
Puu Oo vent. - Can be exposed to SO2 levels as high as 2000
ppb (depends strongly on wind direction,
duration, and speed). - (EPAs regulation 24 hour average from manmade
sources should not exceed 140 ppb SO2)
7
Questions
How does ambient SO2 concentration affect the
pulmonary function of adults? What are the
exposures in Volcano Village? What are
confounding factors in the population of Volcano
Village?
8
Methods
- Study period July 2006 February 2007.
- Concurrent measurement of ambient SO2
concentration with the measurement of pulmonary
function. - Convenience study participants recruited
according to protocol approved by the UH
Committee on Human Studies.
9
Measuring SO2
SO2 was measured every 5 minutes in Volcano
Village using a Interscan 4240-DSP monitor
(Chatsworth, CA). Maximum, average, and
cumulative SO2 concentrations were calculated for
periods of 1, 24, and 72 hours before pulmonary
function testing.
10
Participants
Inclusion Any adults whom lived in Volcano
Village. Exclusion Family or personal history
of diabetes or heart disease, current smokers,
current pregnancy. Total participants 18
11
Measuring Pulmonary Function
- EasyOne spirometers (ndd, Andover, MA) used to
determine Forced Expiratory Volume in one second
(FEV1) and the Forced Vital Capacity (FVC). - 6-8 spirometer measurements per subject per
visit. - Best FEV1 and FVC were selected based on American
Thoracic Society criteria for reproducibility and
acceptability.
12
Statistical Analysis
Because there were multiple measures for each
subject, the use of the Generalized Estimating
Equations model allowed for regression of SO2
concentration with pulmonary function tests
amongst all measurements. Regression was done
via SAS 9.1 (Cary, NC).
13
(No Transcript)
14
Table 1 Measures of SO2 Concentration Prior to
PFT Test Period
maximum SO2 (ppb) maximum SO2 (ppb) maximum SO2 (ppb) average SO2 (ppb) average SO2 (ppb) average SO2 (ppb) cumulative SO2 (ppb) cumulative SO2 (ppb) cumulative SO2 (ppb)
1 24 72 1 24 72 1 24 72
Mean 62 92 114 55 51 49 709 14,535 42,114
SD 54 95 114 38 37 34 495 10,446 29,661
min 19 29 30 18 19 20 234 5,406 17,084
max 30 454 454 192 144 131 2,499 41,522 113,496
Recall
(EPAs regulation 24 hour average from manmade
sources should not exceed 140 ppb SO2)
15
Results
Table 2 Baseline Characteristics of Participating Subjects (n18) Table 2 Baseline Characteristics of Participating Subjects (n18) Table 2 Baseline Characteristics of Participating Subjects (n18)
Age (years) mean 52
Age (years) sd 12
Age (years) range 34-76
BMI mean 23
BMI sd 3.6
BMI range 18-34
male 28
16
Table 3 Pulmonary Function Measurements of the
18 Subjects
Subject ID FEV1 (L) FVC (L) FEV1/FVC Ratio of Tests
6000 3.68 4.73 0.78 4
6001 2.56 3.28 0.78 2
6002 2.48 3.41 0.73 3
6003 3.01 4.27 0.70 3
6004 2.99 4.06 0.74 3
6005 3.01 3.40 0.89 3
6006 3.27 4.38 0.75 2
6007 2.45 3.16 0.78 1
6008 3.18 3.85 0.83 1
6010 2.20 3.04 0.73 3
6011 4.38 4.85 0.90 1
6012 3.75 4.63 0.81 2
6013 2.15 2.80 0.77 2
6015 2.18 3.24 0.67 3
6016 2.93 2.95 0.99 1
6018 2.70 3.26 0.83 1
6019 4.12 5.37 0.77 1
6020 4.54 6.17 0.74 2
17
FEV1
Table 4 Effect of SO2 on FEV1. Table 4 Effect of SO2 on FEV1. Table 4 Effect of SO2 on FEV1. Table 4 Effect of SO2 on FEV1.
Measure Duration (hours) Change in FEV1 per 1 ppb increase p
Maximum 1 -0.0021 0.11
24 -0.0014 0.03
72 -0.0012 0.04
Average 1 -0.0027 0.12
24 -0.0030 0.14
72 -0.0033 0.14
Cumulative 1 -0.0002 0.12
24 -0.0000 0.12
72 -0.0000 0.15
Exposure prior to pulmonary function tests
18
FEV1 to FVC ratio
Table 4 Effect of SO2 on FEV1/FVC Ratio. Table 4 Effect of SO2 on FEV1/FVC Ratio. Table 4 Effect of SO2 on FEV1/FVC Ratio. Table 4 Effect of SO2 on FEV1/FVC Ratio.
Measure Duration (hours) Change in FEV1/FVC per 1 ppb increase p
Maximum 1 -0.00028 0.20
24 -0.00008 0.27
72 -0.00007 0.23
Average 1 -0.00011 0.57
24 -0.00016 0.39
72 -0.00018 0.38
Cumulative 1 -0.00001 0.57
24 -0.00000 0.36
72 -0.00000 0.36
Exposure prior to pulmonary function tests
19
Conclusion
- FEV1 decreased significantly with increases in
SO2 up to a maximum concentration of 450 ppb. - FEV1/FVC did not decrease statistically
significantly in this exposure range. - This may suggest upper airway changes or more
shallow breathing with less evidence of lower
airway obstruction.
20
Future Aims
- Additional monitoring of SO2 at more sites
within Volcano Village during Kona wind seasons. - Increase the power of the study
- increase sample size
- repeated measures (longitudinal)
- Study children
- Fewer chronic conditions
- Potentially more susceptible due to their
larger surface to volume ratio than adults - Shorter
- More active outdoors
- Volcano School of Arts Sciences
- (K-8 140 students), is in the exposure area
21
Implications for Public Health
- On high vog days
- Stay indoors
- Use air conditioning
- Moist handkerchief
22
Special Thanks.
- Dr. Peter Holck
- Dr. John Grove
- Dr. Andrew Grandinetti
- AIR Project Research Team
- (Ed Fernandez, Jennifer Orr, Marianne Yoshida,
Oana Bollt, Beau Dylan Fern, Jeff Sutton, Tamar
Elias)
Supported by Centers for Disease Control, Hawaii
Department of Health, American Lung Association
of Hawaii, Leahi Fund, Hawaii Community
Foundation.
23
Questions?
24
Effects of Volcanic SO2 on Pulmonary Function
Puu Oo Cone, 1983
Reid Hoshide E Fernandez, J Orr, B Brooks, A
Grandinetti, P Holck, EK Tam
Recommended
