
Disparate Virologic Response to HAART between Ethnicities PowerPoint PPT Presentation
Title: Disparate Virologic Response to HAART between Ethnicities
1
Disparate Virologic Response to HAART between
Ethnicities Amy Weintrob1,2, Greg Grandits2,3,
Brian Agan2,4, Anuradha Ganesan2,5, Nancy
Crum-Cianflone2,6, Susan Fraser2,7, Sugat
Patel2,8, Glenn Wortmann1,2, Scott Wegner2,
Vincent Marconi2,4 1Walter Reed Army Medical
Center, Washington, DC 2Infectious Disease
Clinical Research Program, Uniformed Services
University of the Health Sciences, Bethesda, MD
3University of Minnesota, Minneapolis, MN 4San
Antonio Military Medical Center, San Antonio, TX
5National Naval Medical Center, Bethesda, MD
6Naval Medical Center San Diego, San Diego, CA
7Tripler Army Medical Center, Honolulu, HI
8Naval Medical Center Portsmouth, Portsmouth, VA
809
Amy Weintrob, MD WRAMC Bldg 2, Ward 63, Rm
6312 6900 Georgia Ave NW Washington, DC
20307 Amy.Weintrob_at_na.amedd.army.mil (202)
782-8710 phone (202) 782-0551 fax
ABSTRACT
RESULTS
RESULTS (continued)
CONCLUSIONS
Table 1. Comparison of Selected Factors Between African and European Americans Initiating HAART Table 1. Comparison of Selected Factors Between African and European Americans Initiating HAART Table 1. Comparison of Selected Factors Between African and European Americans Initiating HAART Table 1. Comparison of Selected Factors Between African and European Americans Initiating HAART Table 1. Comparison of Selected Factors Between African and European Americans Initiating HAART
Total African Americans European Americans P-Value(AA v EA)
Number in cohort starting HAART 1794 900 894
Demographics
Mean Age at HAART (y) 34.7 8.4 33.9 8.3 35.5 8.3 lt.001
Female () 9.2 12.1 6.3 lt.001
Rank of Officer/Warrant () 10.1 4.9 15.2 lt.001
HIV Disease Factors (mean SD)
Viral Load at HIV diagnosis (log10) 4.4 0.9 4.3 0.9 4.4 0.9 0.285
Viral Load at HAART start (log10) 4.3 1.0 4.3 0.9 4.3 1.0 0.819
CD4 at HIV diagnosis (cells/mm3) 516 247 478 233 552 255 lt.001
CD4 Nadir before HAART (cells/mm3) 285 179 275 168 294 190 0.028
CD4 at HAART initiation (cells/mm3) 350 222 333 209 367 233 0.004
Prior AIDS defining illness () 10.7 10.0 11.4 0.334
Prior ARV Use () 57.2 54.4 60.0 0.018
Initial HAART Regimen () 0.184
PI without ritonavir 61.9 62.4 61.3
PI with ritonavir 7.6 6.2 9.1
NNRTI 22.4 23.0 21.7
Efavirenz ( of total regimens) 19.8 21.3 18.2 0.099
PI plus NNRTI 3.9 3.7 4.1
3 NRTIs 4.2 4.7 3.8
Co-infections at HAART Start ()
Hepatitis B 6.7 8.4 5.1 0.007
Hepatitis C 6.7 7.6 5.8 0.153
Serum Levels at HAART Start
Hemoglobin (g/dl) 14.0 1.6 13.6 1.5 14.4 1.6 lt.001
ALT (u/l) 45.9 50.3 47.1 50.8 44.8 49.9 0.460
Creatinine (mg/dl) 1.0 0.2 1.1 0.3 1.0 0.2 lt.001
Duration Factors
with estimated seroconversion (SC) date 72.3 71.6 73.0 0.482
Estimated SC to HIV diagnosis (months) 10.8 9.0 10.3 8.3 11.3 9.6 0.057
Estimated SC to HAART start (months) 53.2 39.7 52.0 40.4 54.4 38.9 0.273
HIV diagnosis to HAART (months) 57.8 49.1 58.0 50.2 57.7 48.0 0.890
Nadir CD4 to HAART start (months) 14 22 14 24 13 21 0.244
Year Starting HAART 1998 2.4 1998 2.3 1998 2.5 0.332
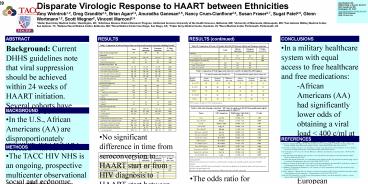
- In a military healthcare system with equal access
to free healthcare and free medications - African Americans (AA) had significantly lower
odds of obtaining a viral load lt 400 c/ml at 6
months and 12 months post HAART initiation
compared to European Americans (EA). - The differences in viral suppression rates
between AA and EA remained significant after
adjusting for age, sex, rank, viral load and CD4
count at HAART initiation, prior AIDS events,
prior antiretroviral use, specific HAART regimen,
hepatitis B co-infection, hemoglobin level, and
year of HAART initiation. - -A subgroup analysis of the interaction between
race and specific HAART regimens demonstrated the
difference in viral suppression between AA and EA
at 6 months was greater for protease inhibitor
based regimens than either NNRTI based or triple
NRTI regimens. - There were no significant differences in time
from seroconversion, HIV diagnosis, or CD4 nadir
to HAART initiation between AA and EA. AA did not
progress faster in terms of CD4 decline or VL
increase between diagnosis and HAART start. - Rates of HAART discontinuation or change were
similar between AA and EA. - Potential reasons for the differences in viral
suppression between AA and EA include - Differences in adherence.
- This study is limited by lack of data on
adherence. - Other studies have shown mixed results as to
whether there are adherence differences between
individuals of different ethnicities1,4-6. - Differences in co-morbidities (including mental
health illnesses)2,5. - Differences in drug absorption, metabolism, and
distribution. - Genetic polymorphisms which may be more common in
certain ethnicities may lead to lower drug
concentrations (thereby decreasing efficacy) or
higher drug concentrations (leading to increased
rates of side effects or toxicities). - Polymorphisms in the gene that codes for CYP2B6
and the gene that codes for MDR1 (which lead to
higher concentrations of Efavirenz and protease
inhibitors, respectively) are more common in AA
but have not been shown to directly affect viral
response to HAART4,7-9. - Given the large number of AA infected with HIV,
it is imperative that we learn why AA do not
obtain the same rate of viral suppression as EA
and intervene appropriately in order to maximize
HAART response and clinical outcome.
Background Current DHHS guidelines note that
viral suppression should be achieved within 24
weeks of HAART initiation. Several cohorts have
shown that African Americans (AA) have different
virologic outcomes post HAART than European
Americans (EA). This disparity has been
attributed, in part, to social and economic
barriers to care. We evaluated the impact of a
health care system with equal access to free
healthcare on these differences. Methods 1031
HIV-infected subjects from a large longitudinal
US military cohort who initiated HAART between
1996-2006 were analyzed to identify factors
related to achieving an undetectable VL (lt 400
c/ml) after 6 months of HAART. Factors
investigated were age, gender, race, baseline
VL, nadir CD4 count, prior AIDS event, prior
antiretroviral use, HAART regimen, era, and
co-morbidities. Logistic regression modeling was
used for univariate and multivariate
analyses. Results Of the 1031 subjects (mean age
34.7 years, 93 male, 43 EA, 45 AA, median VL
at HAART start 33,100 c/ml, mean CD4 nadir 305),
684 (66 overall, 73 of EA, 59 of AA) achieved
viral suppression 6 months after starting HAART.
In the multivariate model, the following were
associated with increased odds of viral
suppression after 6 months increasing age (OR
1.3 per 10 years, 95CI 1.1 - 1.5), EA versus AA
race (OR 2.0, 1.4 - 2.7), lower baseline VL (OR
1.6 per 1 log(10), 1.3 - 2.0), higher nadir CD4
count (OR 1.7 of CD4gt350 compared to lt 200, 1.1 -
2.6), no prior AIDS event (OR 1.5, 1.0 - 2.4), no
prior antiretroviral use (OR 3.8, 2.6 - 5.4),
NNRTI versus PI regimen (OR 1.9, 1.3 - 2.7), and
not having Hepatitis B (OR 2.0, 1.1 - 3.8).
Gender, hemoglobin, HAART era (before year 2000
or on/after year 2000), and Hepatitis C were not
associated with the odds of viral suppression at
6 months. There were no differences between the
ethnicities in initial HAART regimens and at 6
months post HAART, equal percentages of EA and AA
had changed or stopped their initial HAART
regimens. The difference between ethnicities
persisted at 12 months post HAART, where EA had
an OR of 1.7 (95CI 1.3 - 2.0) of achieving viral
suppression compared to AA. Conclusions Despite
access to free healthcare and starting similar
HAART regimens, AA had only half the odds as EA
of achieving viral suppression 6 months after
starting HAART. This difference persisted at 12
months and was not explained by discontinuations
or changes in initial therapy.
Table 2B. Comparison of Factors 12-Months After HAART Between African and European Americans Table 2B. Comparison of Factors 12-Months After HAART Between African and European Americans Table 2B. Comparison of Factors 12-Months After HAART Between African and European Americans Table 2B. Comparison of Factors 12-Months After HAART Between African and European Americans Table 2B. Comparison of Factors 12-Months After HAART Between African and European Americans
Total African Americans European Americans P-Value(AA v EA)
Viral Load
VL lt 400 c/ml () 61.6 55.7 67.9 lt.001
VL change from start 12 mos post HAART (log10) -1.6 1.3 -1.4 1.3 -1.7 1.4 lt.001
HAART Regimen at 12 months () 0.980
No Change from Start 54.0 54.3 53.8
Change - Different HAART 34.4 34.2 34.6
Change - Not on HAART 11.6 11.5 11.6
Table 3. Comparison of Viral Suppression between AA and EA by Initial HAART Regimen Table 3. Comparison of Viral Suppression between AA and EA by Initial HAART Regimen Table 3. Comparison of Viral Suppression between AA and EA by Initial HAART Regimen Table 3. Comparison of Viral Suppression between AA and EA by Initial HAART Regimen Table 3. Comparison of Viral Suppression between AA and EA by Initial HAART Regimen Table 3. Comparison of Viral Suppression between AA and EA by Initial HAART Regimen Table 3. Comparison of Viral Suppression between AA and EA by Initial HAART Regimen
VLlt400 at 6 months after HAART () VLlt400 at 6 months after HAART () VLlt400 at 6 months after HAART () On original HAART regimen after 6 months () On original HAART regimen after 6 months () On original HAART regimen after 6 months ()
HAART Regimen African American European American Difference (AA EA) African American European American Difference (AA EA)
PI w/o RTV 50 69 -19 71 70 1
PI w/RTV 38 68 -38 45 57 -12
NNRTI 78 81 -3 74 68 6
PI NNRTI 47 83 -36 80 54 26
3 NRTIs 83 78 5 71 68 3
RTV ritonavir, p-value 0.07 for overall interaction RTV ritonavir, p-value 0.07 for overall interaction RTV ritonavir, p-value 0.07 for overall interaction RTV ritonavir, p-value 0.07 for overall interaction RTV ritonavir, p-value 0.07 for overall interaction RTV ritonavir, p-value 0.07 for overall interaction RTV ritonavir, p-value 0.07 for overall interaction
Table 4. Odds ratio of having a viral load lt 400 c/ml at 6 months post HAART from multivariate logistic regression model (N1082)a,b,c,d Table 4. Odds ratio of having a viral load lt 400 c/ml at 6 months post HAART from multivariate logistic regression model (N1082)a,b,c,d Table 4. Odds ratio of having a viral load lt 400 c/ml at 6 months post HAART from multivariate logistic regression model (N1082)a,b,c,d Table 4. Odds ratio of having a viral load lt 400 c/ml at 6 months post HAART from multivariate logistic regression model (N1082)a,b,c,d
Factor OR Comparison Multivariate Odds Ratio (95 CI) P-value
Race AA v EA 0.5 (0.4 0.7) lt.001
Age at HAART 10 years 1.3 (1.1 1.6) 0.004
Gender Women v Men 0.8 (0.5 1.4) 0.467
VL at HAART 1 log10 VL 0.5 (0.4 0.7) lt.001
CD4 at HAART 100 cells 1.1 (1.0 1.2) 0.099
AIDS prior to HAART Yes v No 0.8 (0.5 1.5) 0.564
ARV prior to HAART Yes v No 0.3 (0.2 0.4) lt.001
PI with RTV regimen PI w/o RTV 0.8 (0.5 1.3) 0.405
NNRTI regimen PI w/o RTV 1.4 (0.9 2.2) 0.124
PI NNRTI regimen PI w/o RTV 2.5 (1.1 5.6) 0.029
Triple NRTI regimen PI w/o RTV 1.6 (0.7 3.6) 0.244
Hemoglobin at HAART 2 mg/dl 1.0 (0.8 1.3) 0.865
Hepatitis B co-infection Yes v No 0.5 (0.3 1.0) 0.055
Year of HAART start 1 year 1.1 (1.0 1.2) 0.066
aSubjects in multivariate model above had to have values for all factors considered and a viral load result available 6 months after starting HAART bALT was not included in above model due to a limited number of subjects who had ALT measured at the time of HAART initiation cSerum creatinine at HAART initiation and hepatitis C status were not significant in the univariate analysis and therefore were not included in the multivariate model dResults of the above analysis are not significantly different when rank is included in the model aSubjects in multivariate model above had to have values for all factors considered and a viral load result available 6 months after starting HAART bALT was not included in above model due to a limited number of subjects who had ALT measured at the time of HAART initiation cSerum creatinine at HAART initiation and hepatitis C status were not significant in the univariate analysis and therefore were not included in the multivariate model dResults of the above analysis are not significantly different when rank is included in the model aSubjects in multivariate model above had to have values for all factors considered and a viral load result available 6 months after starting HAART bALT was not included in above model due to a limited number of subjects who had ALT measured at the time of HAART initiation cSerum creatinine at HAART initiation and hepatitis C status were not significant in the univariate analysis and therefore were not included in the multivariate model dResults of the above analysis are not significantly different when rank is included in the model aSubjects in multivariate model above had to have values for all factors considered and a viral load result available 6 months after starting HAART bALT was not included in above model due to a limited number of subjects who had ALT measured at the time of HAART initiation cSerum creatinine at HAART initiation and hepatitis C status were not significant in the univariate analysis and therefore were not included in the multivariate model dResults of the above analysis are not significantly different when rank is included in the model
BACKGROUND
- In the U.S., African Americans (AA) are
disproportionately infected with HIV. - Studies of HAART efficacy have predominantly
involved men of European descent. - Biologic or behavioral differences between races
may impact response to HAART1-3. - Several studies1-3 have shown that compared to
European Americans (EA), AA - obtain undetectable viral loads less often
- experience viral rebound more often
- The objective of this study is to determine if
there is a difference in virologic response to
HAART between AA and EA subjects enrolled in the
TriService AIDS Clinical Consortium (TACC) HIV
Natural History Study (NHS) where there is equal
access to free healthcare and medications.
- No significant difference in time from
seroconversion to HAART start or from HIV
diagnosis to HAART start between AA and EA. Also
no difference in time from nadir CD4 count to
HAART start between the two races. - AA had lower CD4 counts at HIV diagnosis and at
HAART start although the decline in CD4 counts
from HIV diagnosis to HAART initiation was not
faster in AA compared to EA. - No significant difference in VL at HIV diagnosis
or at HAART initiation between AA and EA. - No difference in initial HAART regimens between
AA and EA.
REFERENCES
1. Anastos K, Schneider MF, Gange SJ, et al. The
association of race, sociodemographic, and
behavioral characteristics with response to
highly active antiretroviral therapy in women. J
Acquir Immune Defic Syndr 200539537-44. 2.
Pence BW, Ostermann J, Kumar V, et al. The
influence of psychosocial characteristics and
race/ethnicity on the use, duration, and success
of antiretroviral therapy. J Acquir Immune Defic
Syndr 200847194-201. 3. Moore R, Keruly J, Gebo
K, Lucas G. Racial differences in Efavirenz
discontinuation in clinical practice. 12th CROI
2006 poster 619. 4. Gulick RM, Ribaudo HJ,
Shikuma CM, et al. Three vs four drug
antiretroviral regimens for the initial treatment
of HIV-1 infection. JAMA 2006296769-81. 5.
McGinnis KA, Fine MJ, Sharma RK, et al.
Understanding racial disparities in HIV using
data from the Veterans Aging Cohort-3 site study
and VA administrative data. Am J Public Health
2003931728-33. 6. Gifford AL, Bormann JE,
Shively MJ, et al. Predictors of self-reported
adherence and plasma HIV concentrations in
patients on multidrug antiretroviral regimens. J
Acquir Immune Defic Syndr 200023386-95. 7.
Schaeffeler E, Eichelbaum M, Brinkmann U, et al.
Frequency of C3435T polymorphism of MDR1 gene in
African people. Lancet 2001358383-4. 8. Fellay
J, Marzolini C, Meaden ER, et al. Response to
antiretroviral treatment in HIV-1 infected
individuals with allelic variants of the
multidrug resistance transporter 1 a
pharmacogenetics study. Lancet 200235930-6. 9.
Haas DW, Wu H, Haihong L, et al. MDR1 gene
polymorphisms and phase 1 viral decay during
HIV-1 infection. J Acquir Immune Defic Syndr
200334295-8.
METHODS
- The TACC HIV NHS is an ongoing, prospective
multicenter observational study which began in
1987 and has followed approximately 5000
HIV-infected persons, half of whom have
documented negative HIV tests prior to their
first positive test allowing for estimation of
their seroconversion date. In the TACC HIV NHS,
race is self-reported. - 900 AA and 894 EA who initiated HAART between
1996-2004 were compared for virologic response to
HAART and for selected factors at the time of
HAART initiation which may affect virologic
response. - Logistic regression modeling was used for
univariate and multivariate analyses of factors
related to achieving an undetectable viral load
(lt400 c/ml) at 6 months and 12 months post HAART
initiation.
Table 2A. Comparison of Factors 6-Months After HAART Between African and European Americans Table 2A. Comparison of Factors 6-Months After HAART Between African and European Americans Table 2A. Comparison of Factors 6-Months After HAART Between African and European Americans Table 2A. Comparison of Factors 6-Months After HAART Between African and European Americans Table 2A. Comparison of Factors 6-Months After HAART Between African and European Americans
Total African Americans European Americans P-Value(AA v EA)
Viral Load
VL lt 400 c/ml () 65.6 58.3 73.3 lt.001
VL change from start 6 mos post HAART (log10) -1.6 1.3 -1.5 1.3 -1.8 1.3 lt.001
HAART Regimen at 6 months () 0.461
No Change from Start 69.0 70.4 67.6
Change - Different HAART 20.7 19.4 22.1
Change - Not on HAART 10.2 10.1 10.4
- The odds ratio for obtaining a viral load lt400
c/ml at 12 months post HAART for AA compared to
EA (N1017) is 0.6 (0.4 0.8) in the
multivariate model adjusting for the same factors
as above.
Recommended
