
Topographic Maps PowerPoint PPT Presentation
Title: Topographic Maps
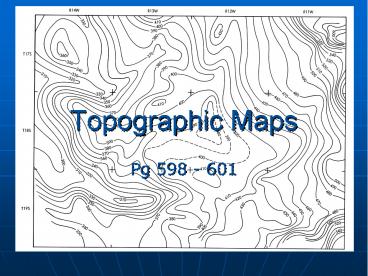
1
Topographic Maps
- Pg 598 - 601
2
Lesson Objectives
- Define a topographic map and its uses.
- Describe how contour lines show the elevations,
shape, and slope of the land. - Identify the meanings of some symbols and colors
used on topographic maps. - Create a topographic profile
3
What is a topographic map?
- A topographic map, also known as a contour map,
is a map that shows the elevation/shape of the
land using contour lines. - Elevation - how high and low the ground is in
relation to sea level.
4
What are contour lines?
- Contour lines are lines that connect points that
are of the same elevation. - Contour lines never touch or cross.
5
What is a benchmark?
- A benchmark is a point where exact elevation is
known and is marked with a brass or aluminum
plate. - Benchmarks are useful to help determine contour
lines.
6
Other Topographic Terms
- Map scale compares distances on the map with
distances on earth. - Legend explains symbols used on the map.
- Index contours contour lines that are labeled
to help you find the contour interval.
7
What is a contour interval?
- A contour interval is the difference in elevation
between two contour lines that are side by side. - Remember that a contour interval is not the
distance between the two lines to get the
distance you need to use the map scale.
8
What if my contour lines are close together?
- If the contour lines are close together, then
that indicates that area has a steep slope.
9
What if my contour lines are far apart?
- If the contour lines are far apart, then that
indicates the land has a gentle slope (low slope).
10
What do the dark colored contour lines mean?
- The dark colored contour lines represent every
fifth contour line to make it easier to read the
map.
11
What do depressions in the map look like?
- A depression, such as the inside of a dead
volcano, is represented by Hachure lines. - Hachure lines are regular contour lines with
small segments sticking out from it. - The first hachure line is at the same elevation
as the contour line before it.
12
Hachure Lines/Depression
13
More on Contour Lines
- Contour lines form Vs that point upstream when
they cross a stream. - It is important to remember that they point in
the opposite direction as the flow of water.
14
What do the colors on the topographic map
represent?
- Blue lines/shapes - represent water features,
such as streams and lakes. - Brown contour lines
- Black Roads, buildings, railroads, other man
made objects. - Green Woodland areas
- Red - Highways
15
Topographic Profile
- Pencil the line of your interest in lightly on
your map - Place a blank piece of paper along the line you
have drawn. - On both the blank paper and the map, mark clearly
the starting and ending points of your line of
section. Below these marks, write down the
elevation of the starting and ending points of
your section.
16
- Make a tic mark wherever the paper crosses a
contour line on the map. Write the elevation of
the index contours below their tics on your paper
17
- Get a piece of graph paper that is at least as
long as your line of section. Place your paper
with the tic marks on the graph paper and mark
the starting and ending points of your line.
18
- Beginning with your starting elevation, go
directly above the tic mark on your paper and
make a small dot on the graph paper at the
corresponding elevation. Connect the dots on the
graph paper.
19
Review Questions
- How are contour lines drawn on maps?
- How does a contour map show whether a slope is
gentle or steep?
Recommended
