
Orienteering PowerPoint PPT Presentation
1 / 16
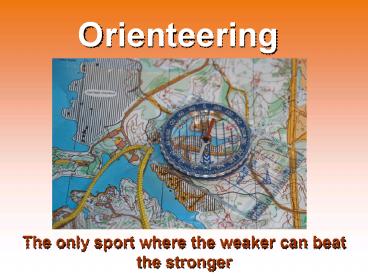
Title: Orienteering
1
Orienteering
- The only sport where the weaker can beat the
stronger
2
Orienteering comes from the Swedish word
orienteringmeaning, to orientate yourself and
adapt to the terrain.
3
Orienteering was originally part of military
training.In the early 1900s civillians in
Scandinavia started this as a sport.Now it is a
widely practiced sport all over the world.
4
Orienteering requires effective strategy and
making rapid decisions.
Physical fitness is not the only element You
need to use your brain!
5
Orienteering usually takes place in the open
terrain.
The competitors map will contain a series of
control points. The competitor must visit these
control points in the given order, racing against
time.
6
The only aid allowed to help find your way is a
compass.
The orienteer finds his/her way using the compass
and reading the details marked on the map.
7
At each control point, there is the orange and
white control flag showing that you came to the
correct point.
You punch at the control point to show you came
here.
8
Punching may be done electronically, or using a
punch hanging from the control flag.
9
Orienteering can be done on foot (Foot-O)
by mountain bike (MTB-O) skiing (Ski-O) in
wheelchairs for the physically handicapped
(Trail-O)
10
An orienteering map is different from a
topographic map
Mountaineers use a topographic map. The scale is
usually 1 / 25 000 or 1 / 50 000 A topographic
map shows only very distinct roads and
vehicle tracks only distinct rivers forests -
green open areas - white
11
An orienteering map is more detailed
The scale is usually 1/10 000. vegetation is
more detailed each colour has a meaning showing
difference in vegetation very small streams,
even dried up water courses are shown even
small paths, tracks are shown
12
What can you see on a course map for orienteering?
1 - The scale2 - The elevation (difference in
height) between two contours --gt contour
interval3 - The category this course belongs
to4 - The length of the course (as the crow
flies)
5 - Control point definitions 6 - The course
itself, shown by the start (triangle) the
finish (two concentric circles) the control
points (single circle)
13
THE SCALE
The scale of the map is useful in estimating the
distance from where you are now, and where you
want to go. 1 / 10 000 1 cm on the map 100
meters on the terrain 1 / 5 000 1 cm on the
map 50 meters on the terrain You need to know
how to count your paces!
14
Pace counting
Homework Measure your pace for 100 meters
count 2 paces for 1 count - uphill -
downhill - flat count - walking -
jogging - running
15
Contour interval
The contour interval shows the vertical
difference in height (the elevation) between two
contours. Contour interval 5 m 5 m One and a
half stories in a block of flats The distance
between two contourson the map will show the
effortfor climbing
Less effort Steep climb
16
Contour interval
Homework if the contour interval is 5 m
Assuming the first contour lies at the lowest
point (car park surface), how many contours
for A? B? C? Which one has the most climb? Note
most climb may not mean longest distance!
B
C
A
Recommended
