
Example of Poisson Distribution-Wars by Year PowerPoint PPT Presentation
1 / 3
Title: Example of Poisson Distribution-Wars by Year
1
Example of Poisson Distribution-Wars by Year
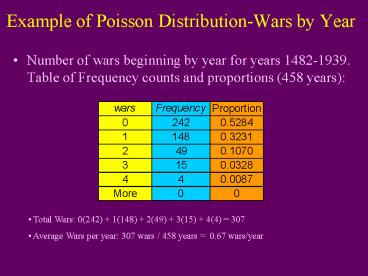
- Number of wars beginning by year for years
1482-1939. Table of Frequency counts and
proportions (458 years)
- Total Wars 0(242) 1(148) 2(49) 3(15)
4(4) 307 - Average Wars per year 307 wars / 458 years
0.67 wars/year
2
Using Poisson Distribution as Approximation
- Since mean of empirical (observed) distribution
is 0.67, use that as mean for Poisson
distribution (that is, set l 0.67) - p(0) (e-ll0)/0! e-0.67 0.5117
- p(1) (e-ll1)/1! e-0.67(0.67) 0.3428
- p(2) (e-ll2)/2! e-0.67(0.67)2/2 0.1149
- p(3) (e-ll3)/3! e-0.67(0.67)3/6 0.0257
- p(4) (e-ll4)/4! e-0.67(0.67)4/24 0.0043
- P(Y?5) 1-P(Y?4)
- 1-.5117-.3428-.1149-.0257-.00430.0006
3
Comparison of Observed and Model Probabilities
- In EXCEL, the function POISSON(y,l,FALSE)
returns p(y) e-lly/y!
The model provides a good fit to the observed
data. Formal tests of goodness-of-fit are covered
in the sequel course.
Recommended
