
SelfService Checkout' PowerPoint PPT Presentation
1 / 23
Title: SelfService Checkout'
1
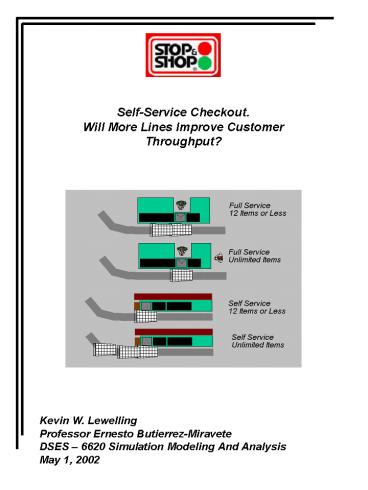
Self-Service Checkout. Will More Lines Improve
Customer Throughput?
Kevin W. Lewelling Professor Ernesto
Butierrez-Miravete DSES 6620 Simulation
Modeling And Analysis May 1, 2002
2
Table Of Contents
Page
Executive Summary 1 Introduction 2 Current
Checkout Area Layout Locations 2 Customer
Processing Events 4 Simulation
Approach 7 Modeling Approach 7 Data
Collection 8 Data Processing 8 Results 9 Conclu
sion / Recommendations 13 APPENDIX A
Optimization Spreadsheet APPENDIX B Arrival
Service Time Raw Data APPENDIX C Processed
Data APPENDIX D Simulation Input Text
Files APPENDIX E Simulation Output Test
Files APPENDIX F Original Project
Proposal APPENDIX G Final Presentation Slides
3
Executive Summary The objective of this
project was to determine whether there exists an
optimal combination of self-service and full
service lines that could maximize customer
throughput at the Stop Shop Supermarket in
Hamden, CT. Currently Stop Shop has installed
5 self-service checkout lines in addition to the
18 standard full-service checkout lines. Two of
the new self-service lines have been designated
for customers with 12 items or less while the
remaining 3 lines are designated for customers
with an unlimited number of items. To compare
the performance of the new self-service lines in
the existing system, inter-arrival and service
time data was recorded between the hours of 1100
am and 100 pm, peak service times for Stop
Shop, for each of the four checkout line types
self-service unlimited, self-service 12 items or
less, full-service unlimited, and full-service 12
items or less. This data was then reduced using
StatFit to allow the inter-arrival and service
times to be represented analytically. An
analytical simulation model was created with
visual process simulation characteristics to
analytically re-enact the checkout line customer
throughput process. Analysis of each of the four
service scenarios, using inter-arrival and
servicing times stoichastically represented using
a pseudo-random number generating approach with
distributions related back to the true arrival
rates, was run to establish the average total
number of customers serviced per hour for each
check-out line type. Given a few basic
restrictions on the line combinations, all
checkout line combination types were analyzed for
two scenarios, lines that accepted an unlimited
number of items and those that accepted customers
with 12 items or less, to fully understand the
impact of each line combination. It was also
assumed that all service lines would be open for
service, a scenario most likely achievable just
before a major holiday like Thanksgiving or
Christmas. What was found is that for the 12
item-or-less checkout lines, installation of the
new self-service 12-item-or-less isles provided
no increased customer throughput. This was due
mostly to the fact that of the 5 possible
12-item-or-less checkout lines, the full-service
lines were much more efficient in servicing
customers than the self-service lines. For the
checkout lines that allowed an unlimited number
of items, it was also found that the addition of
the new self-service lines actually limited
customer throughput. In fact, converting all
chekcout lines back to the original full-service
configuration provided the highest customer
throughput. So, based on the original request,
there is no customer throughput benefit to be had
by installing any additional self-service
checkout lines. However, considering the cost
benefit that could be had by eliminating the
checkout personnel required in a full-service
checkout line, a financial benefit outside the
scope of this study may reveal a significant
operating cost reduction.
Page 1
4
Introduction Stop Shop currently provides
two grocery checkout methods full-service
checkout and self-service checkout. The
full-service checkout lines use the traditional
checkout method. Customers load their groceries
or items onto a convey, a Stop Shop associate
scans the items while another associate, if
available, bags the scanned items and places the
filled bags in the customers shopping carriage.
The self-service checkout method allows customers
to scan their items, pay for their purchase and
bag without the interaction of any Stop Shop
associate. Of the 23 total checkout service
lines, Stop Shop recently replaced 5
full-service checkout lines, with self-service
checkout lines while the remaining 18 service
lines retain full-service status. The entire
checkout area currently occupies 146.5 feet of
floor space at the front of the store. Within
this space, three fundamental checkout line
widths exist. Self-service lines are 5.5 feet
wide. Most full-service lines are 6.5 feet wide
while 4 full-service handicap accessible lines
are a full 7 feet wide. Although the new
self-service lines appear to process customers a
bit slower than any of the full service lines,
their narrower width, the result of eliminating a
checkout associate, may prove to be beneficial by
allowing the installation of more self-service
checkout lines in the same floor space. Aside
from the obvious reasons for installing the
self-service checkout lines (i.e. the elimination
of some checkout associates), Stop Shop wants
to know whether the overall customer throughput
could also be improved by replacing more
full-service checkout lines with the narrower
self-service lines. The focus of this study was
to determine the optimum checkout line
configuration that maximizes customer throughput
at the maximum customer service load. Current
Checkout Area Layout - Locations As mentioned
earlier, 23 checkout lines accommodate the
customer checkout as shown in Figure 1. As the
figure shows, the five self-service checkout
lines reside on the far left had side of the
Figure 1
Page 2
5
checkout area. Also identified are those lines
that target customers with 12 items or less as
well as those lines designated for handicap
access. Full Service Checkout Lines As
mentioned earlier, each standard full service
line, whether it is designated to serve customers
with an unlimited number of items or customers
with 12 items or less, measures 6 ½ ft wide as
depicted in Figure 2. For convenience, 4 of the
18 total full service checkout lines measure
Bagging Associate
Full Service Checkout Line Configurations
Unlimited Standard Width
6 ½ ft
Unlimited Handicap Width
7 ft
12 or less Handicap Width
7 ft
12 or less Standard Width
6 ½ ft
Arrival Queue
Checkout Associate
Gathering Area
Service Location
Feeder Conveyor
Exit
Figure 2
a full 7 ft wide to enable handicap access. The
current full service checkout area utilizes 119
ft of floor space. Of the 18 full service lines,
2 lines are designated for customers with 12
items of less with 1 of the 2 lines 12 item or
less lines for handicap access. The remaining 16
full service checkout lines currently allow
service for customers with an unlimited number of
items and are comprised of 13 standard width
checkout lines and 3 wider handicap access lines.
Each unlimited checkout line requires two
checkout associates, the scanning associate and a
bagger. The two
Page 3
6
checkout lines that accommodate 12 items or less
only require one associate to perform both
duties, scanning and bagging. In general, three
processes take place in the full-service checkout
system. There are customer arrivals, services,
and exits. Arrivals occur in all lines on the
left hand side of the checkout line. The
customer loads their items onto a conveyor where
they are fed to a checkout associate. The
checkout associate scans the items and, depending
on the line type, will either bag the items or
send them off to a bagging associate. Near the
end of the checkout process, the customer
proceeds to a payment location, pays the checkout
associate and then exits the checkout
system. Self-Service Checkout Lines Each of
the 5 self-service checkout lines shown in Figure
3 measure 5 ½ ft wide, regardless of their
designation (12 items or less or unlimited).
Upon arriving at the checkout line, customers
Figure 3
congregate in the usual fashion, which is at the
entrance to the checkout line. Unlike the
full-service system, items are scanned at the
beginning of the checkout line and are then
placed on a series of conveyors. The conveyors
carry the items to a gathering area where it is
then the customers duty to bag their own
groceries. The gathering area can easily
accommodate up to 20 items. However, depending
on the number of groceries a customer has, a
situation may arise where the customer will have
to stop scanning items because no other items can
fit in the gathering area and the system has
begun to back up. When this occurs, the customer
must remove (bag), the groceries in the gathering
area before additional items can be scanned.
Once all items have been scanned, the customer
pays through an automated payment system. At
this time, coupons can also be scanned. The
self-service system will accept all forms of
payment, the easiest of course being performed
using a credit card. Once the payment process is
complete the customer exits the
system. Customer Processing
Events Regardless of the service line
configuration, each customer follows the same
event sequence. Customers arrive, service is
performed, and customers exit. In real life
though, many other mini
Page 4
7
processes take place that are very difficult to
quantify. The following event sections contrast
the differences between actions that happen in
real life to those that can actually be
quantified for simulation. Arrivals Each of us
have been to the super market and encountered
this same scenario. When it comes to checkout
and based on our past experience, a whole litany
of subjective logic processing goes through our
mind when selecting the checkout line that will
get us serviced the fastest. At first, typically
we will observe each of the open checkout lines
to determine which appears to have the shortest
arrival queue. Usually the observation only
extends to within 5 or 6 checkout lines away from
the initial approach into the checkout area.
From these few lines, well then observe how full
the carriages or basket are for the customer(s)
in front of us. Then based on the number of
items in the proceeding customers carriage,
checkout line selection is made. This may mean
that we might select a checkout line with an
arrival queue that has more people in it than
another arrival queue, but the proceeding
customers have far fewer items than the arrival
queue with fewer customers. However, sometimes,
the advantage of one line over the other is
indistinguishable. If shopping alone, one might
find them self shifting back and forth between
lines based on each lines instantaneous progress.
Or if shopping with a companion, one might
reserve a turn in one line while the other
remains with the carriage or basket in another
line, all the while continuously assessing the
progress of each respective line to once again,
determine what will get them serviced the
fastest. This technique however complicates the
selection process for newly arriving customers.
Newly arriving customers often will have this
technique unveiled to them at the most
inopportune time. The newly arriving customer
may have made a line selection with the premise
that a line appeared faster based solely on fact
that each proceeding customer appeared to have
fewer items for checkout than any of the other
lines. After a short amount of time in the
arrival queue, the ploy unfolds to the chagrin of
the newly arrived customer so that now the
carriage bearing companion moves into the line of
their compatriot who originally appeared to have
little or no items for checkout. Does the newly
arrived customer leave the arrival queue based on
the new circumstances or not? Sometimes they do
and sometimes not. For the full-service
checkout lines, the arrival process continues
into the checkout line itself with items being
loaded onto the feeder conveyor. Termination of
the arrival process is signified with the
scanning of the new customers first item. For
the self-service checkout lines, observation
revealed that patrons would enter or not enter a
line based on the number of customers in the
line, number of items in a proceeding customers
shopping cart or basket, or the confidence level
exuded by the proceeding customer (for instance,
if a customer appears to be confused, their line
may be skipped for another line whose customer is
fluidly processing their items). Those lines
that serviced customers that appeared slow to
process items were passed over for other lines
with often more patrons but that seemed to move
at a pretty smooth pace. Servicing Full
Service By the time the customer is about to
begin service, some if not most of their items
have been
Page 5
8
loaded onto the feeder conveyor. Servicing is
initiated with either the scan of a scan saver
card, which acts like a virtual savings coupon,
or the scan of the first item. During the
scanning process, the customer may either
continue to load more items onto the feeder
conveyor as more room becomes available or may
assist with the bagging of scanned items. Once
all of the items have been scanned, coupons, if
any, are then scanned for additional savings..
Payment arrangements are negotiated and the
payment transaction is completed. If not all the
items have been bagged, the checkout scanning
associate will also assist in bagging the
remaining items. Once all of the items have been
bagged from the collection area, the next
customer begins processing, even before the
proceeding customer has left the checkout
line. On occasion, significant delays can be had
if an item is not properly marked and does not
have a price tag on it. If this situation
occurs, another associate is called upon to
retrieve another item that is properly marked or
that has a legitimate a price on it. These types
of situations can delay the servicing process
several minutes, which is a high percentage of
the total time that the customer spends getting
serviced. Servicing Self Service The
self-service system does for the customer exactly
what its name implies. It allows the customer to
scan their own items, use coupons, and pay on
their own without the interaction of any store
associate. From time to time, a problem will
arise during the checkout process. To handle
these instances, Stop Shop has up to three
customer service representatives that circulate
between each of the five self-service checkout
lines to assist customers in their checkout
process. Unlike the full service checkout
system, self-service processing begins at the
beginning of the self-service checkout line.
Customers arrive at the self-checkout line and
begin scanning immediately. There is no
intermittent loading of a feeder conveyor. Items
are taken directly from the carriage or basket,
scanned at the scanner, and placed on a conveyor
where they are taken to the collecting area of
the checkout line. Now heres where the checkout
process can get a little complicated if the whole
process is not executed flawlessly. If a
customer misses the scan of an item but places
that item on the conveyor anyway, the system will
be alerted to the fact that an item has passed
through the system without being scanned. In
this instance, typically the conveyor will
reverse direction to bring the item back to the
customer. More often than not, though this will
cause a failure in the system requiring one of
the customer service associates to assist the
customer with the problem. Customers with
coupons also face a high chance in processing
delay as the coupon entry process can be very
sensitive. Also complicating the checkout out
process is the handling of produce since there
are no barcodes on most produce items. For this,
the self-service system provides a lookup system
through which the customer searches for the
correct produce item match. Lack of familiarity
with the system often delays the checkout
process. Once the customer has finished
scanning their items, the coupon process is
completed and the customer selects the finish and
pay option. The self-service system currently
accepts credit and debit cards directly as well
as good old cold cash. Checks can also be
accepted, but customers will have to proceed to
one of the customer service associates for
further assistance.
Page 6
9
Exits Regardless of the checkout system, all
system exits are the same. Each exit usually
entails the customer gathering them self together
while still in the checkout line. With receipts
and wallets stowed, the customer proceeds to exit
the checkout line and merge into all other
exiting traffic. Occasionally exits can be
delayed if an item has been forgotten to be
scanned because it was under the carriage and
wasnt noticed during the scanning process. For
this, the item is then rung up and the customer
will have to complete the paying process all over
again. Simulation Approach Given all of the
above arrival, processing and exit descriptions,
it became evident very quickly that accurately
simulating the system checkout process could
become a daunting task. Furthermore, my request
at the local Stop Shop to collect data was well
received but limited the scope to which data
could be collected. I was allowed to take as
much data as I wanted so long as my observations
were unobtrusive and I did not interact with the
customers or get in the way of the whole process.
Given these restrictions, at best the only data
that could be compiled had to be limited to what
I could see without getting too close to the
checkout system. For this, all that could be
observed were arrivals and the servicing process,
which enormously narrowed the scope of this
simulation effort. Therefore, a number of
assumptions and guidelines were established to
more appropriately fit the scope of this project
given the amount of data that was available.
These assumptions are outlined in the following
section. Locations 12 Items-or-less 1 line
will remain full-service and handicap accessible.
4 lines may be full or self-service. Unlimited
number of items 3 lines will remain
full-service and handicap accessible. 15 lines
may be full or self-service Checkout Floor Area
Width Although the current configuration exists
within a discrete floor area envelope, it is
foreseeable that when optimizing the various
checkout configurations, slightly more or less
floor space will be required to accommodate the
optimized throughput configuration. Therefore,
it will be acceptable that the floor area breadth
required be no more than an additional 50 of the
widest checkout line, or 3 ½ ft. Modeling
Approach Fortunately, the processing that
occurs at the checkout line is a simple process,
essentially a single server system that can be
represented by a GG1 or am MG1 (one instance)
queueing process. However, with 4 locations
designated in the checkout process the arrival
location, the arrival queue, the checkout
location and an exit location, 23 total checkout
lines with 4 locations per line exceeds the
modeling capacity of ProModels Student Version.
Because of this, two modeling
Page 7
10
requirements became disallowed. First, the
entire checkout system could not be modeled all
at once, and second, because the entire system
couldnt be modeled, Sim Runner also couldnt be
run to optimize the checkout system. Granted,
the number of locations could have been reduced
from 4 to 2 (an arrival queue and a service
location), but with 18 unlimited service
combinations alone, this would require a minimum
of 36 locations which still far exceeds the
Student Editions capacity. To simplify the
process, it was then assumed that each checkout
line type would perform consistently for that
checkout line type. What this means is that by
simulating the performance of just one line, with
little standard deviation, the total number of
exits per hour could be calculated. This data
could then be input into an excel spreadsheet
where all combinations could be analyzed in a
table. Given this approach, each processing type
was run until so that the 95 confidence interval
was satisfied. Once this condition was met, the
average customer throughput per hour was
calculated and input into an optimization
spreadsheet as shown in Appendix A. Two separate
sections were set up in the spreadsheet. The
first section was used to analyze the Unlimited
Item checkout line combinations, while the second
section was used to analyze the 12-item-or-less
checkout line combinations. Data Collection A
total of four hours (2 people collecting data for
2 hours) of data was collected on the processing
of customers through each of the four types of
checkout lines. A Sunday was chosen, between the
hours of 1100 am and 100 pm to collect data as
this time has been found to be, in general, one
of the busiest times of the day for the
supermarket. When recording arrival data, a
customer arrival was recorded when a customer
actually entered a line for service. Customers
that slowed to where a line began but then moved
to the next (better) line were recorded to have
arrived once they entered the line that they
stayed in, not when they entered the arrival line
area. When collecting service time data, service
was recorded as having begun when the customers
first item was scanned, which could be either a
grocery or scan-saver card. Service ended either
when the next customer in line scanned their
first item, or in the event there wasnt another
customer in line, when the customer exited the
checkout line all together. The arrival and
service time data can be found in Appendix
B. Data Processing With the data collected,
each arrival and service data point was entered
into StatFit to determine the best analytical
representation of the data. Once in StatFit,
all of the standard data processing tests were
performed on the data, which included running the
autofit function, on each of the eight data sets
(4 arrival data sets and 4 service data sets).
The top four best analytical data fit
approximations were then tested in each of the
four simulation models for accuracy and to
determine whether the results made sense. Some
of the analytical approximations that scored the
highest in the autofit test performed terribly
when applied to the simulation models. For the
arrivals, one criteria that was used to determine
whether the analytical arrival rate approximation
was valid was to run the simulation and then look
at how many customers accumulated in the arrival
queues. In practice, not more than 4 or 5
customers would be waiting in any of the arrival
Page 8
11
queues at any one time. If the simulation
predicted more customers waiting in the arrival
than ever observed, the analytical arrival rate
was rejected and another arrival rate tested. It
should be noted though that the length of the
arrival queue is also closely coupled to the
service times. This often resulted in the
running of numerous arrival and service time
combinations before a sensible combination could
be arrived upon. Fortunately though, service
times were usually well behaved and gave few good
options aside from the better fit analytical
approximations. Therefore, more often than not,
analytical service times were represented by the
highest ranked curve fits. Results After
completing each of the simulation scenarios, it
was found, as shown in Figures 4, 5 and 6 that
Stop Shop achieved the highest customer
throughput with no self-service checkout lines.
Total Customer Throughput for Given Checkout Line
Configurations Unlimited Item Lines
Figure 4
Curve Enlarged Below
Number of Checkout Lines
Total Customer Throughput
Fewer Self Service Checkout Lines
Total Customer Throughput for Given Checkout Line
Configurations Unlimited Item Lines
Figure 5
Total Customer Throughput
Fewer Self Service Checkout Lines
Page 9
12
Figure 6
Total Customer Throughput for Given Checkout Line
Configurations 12 or Less Lines
Number of Checkout Lines
Total Customer Throughput
Therefore the original hypothesis that additional
customer throughput could be had with some
combination of full and self-service lines by the
virtue that the self service lines were narrower,
was false. However, given the savings that could
be had by eliminating some of the staff required
to man the full service lines, it was found that
there were other line configurations that did
reduce the manpower required but still maintained
similar customer throughput. They are presented
in the following sections. Unlimited Item
Service As Figure 7 shows, a maximum customer
throughput of 446 customers per hour is achieved
with
Figure 7
Page 10
13
all unlimited checkout lines configured as full
service lines. In retrospect, this makes perfect
sense since the efficiency and fluidity of the
checkout operation is no better achieved than in
the hands of a trained checkout associate.
However, if Stop Shops ultimate goal is to
minimize operating costs at the expense of
reduced customer throughput, than some other
options exist. The current installation, which
utilizes 3 self-service unlimited item checkout
lines with the remaining 15 checkout lines
configured for full-service operation, can
achieve a simulated throughput of 426 customers
per hour. Analysis showed though that another
checkout service line configuration that utilizes
7 self-service checkout lines and 12 full-service
checkout lines could yield a simulated throughput
of 425 customers per hour, just one customer less
than the current configuration. The 7
self-service checkout line configuration is able
to compete with the current 3 self-service line
configuration by allowing the installation of an
additional checkout line without taking up more
floor space. Each line configuration discussed
in this section is presented in Figure 8.
Figure 8
12 Items-or-Less Service As shown in Figure 9,
the maximum customer throughput of 338 customers
per hour for customers with 12 items or less is
achieved, as was true with the unlimited item
service lines, with each checkout line configured
for full-service processing. Like before
however, if operating cost becomes a heavily
weighted attribute to trade, especially
considering that the number of items per customer
is so low for this type of checkout line, the
current configuration may provide a savings not
quantifiable through this study even though its
throughput is significantly less at 238 customers
per hour. Ultimately, because there are so few 12
item of less checkout lines, there is little
latitude when trying to take advantage of the
size benefit offered by the narrower self-service
checkout lines, for any real throughput
performance to be realized. Each line
configuration discussed in this section is
presented in Figure 10.
Page 11
14
Figure 9
Figure 10
Page 12
15
Conclusions / Recommendations If everyone
worked for free, i.e. employee cost was not an
issue, the hands down conclusion from this study
is that Stop Shop should replace all of the new
self-service with the old full-service checkout
lines, regardless of the checkout line type.
However, nobody works for free so the decision
becomes a bit more complicated and unfortunately,
is best answered with the aid of collaborating
data outside the scope of this study. Other data
that would also help to understand the process
would be the number of items each customer
purchases and at what cost. It was observed that
customers that had very full carriages typically
migrated to the full-service checkout lines.
This data would further help justify the
existence of the checkout associate since not
only do the full-service lines service more
customers per hour, on average, theyre also
moving more items through the system which
compounds the profits. After speaking with the
Stop Shop manager, the real reason for Stop
Shops recent installation of the self-service
checkout systems is that, on the off peak hours
when few customers are in the store, usually at
around 1100 at night, the new 5 self-service
lines are always available and open to service
these customers. And for these times, when it is
difficult for Stop Shop to predict the number
of checkout associates needed to staff the
checkout system, S S can always plan on having
at just one full service line open with the
overflow being handled by the self-service
systems. In closing, a conclusion can be had
from this entire study and from that comes a
recommendation. It is clear that there is no
immediate replacement for the efficiency and
capacity of the full-service checkout system, at
least not for the next 15 years. There will
always be a need, for one reason or another for
the full-service checkout system. But, since
Stop Shop has gone beyond the point of mere
alternate system consideration and have actually
installed an alternative checkout method, it
would follow that if they will entertain one
system, they will entertain others. My
suggestion to meet the requirements of both
worlds is to replace all of the current checkout
lines with a hybrid system, a system that would
enable both self-service and full-service. With
this, Stop Shop would have the best of both
worlds maximum customer throughput on those
super busy occasions and nearly unrestricted
throughput the rest of the time. In fact, with
so many checkout lines open for service, arrival
queues would more than likely shorten allowing
for more compact arrival queue areas in the
store. The details of such a system have yet to
be worked out fully, but are best left as a
venture for the suggesting party. It would be
unfair if I did not give a special thanks to Mr.
Guy Pititto and Mr. Mike Smith, both managers of
the Hamden, CT Stop Shop, for their valuable
insight and for allowing me to collect data at
their store. I would also like to thank my wife
Sarah for here enormous help in collecting that
data.
Page 13
16
APPENDIX A Optimization Spreadsheet
17
APPENDIX B Arrival Service Time Raw Data
18
APPENDIX C Processed Data
19
APPENDIX D Simulation Input Text Files
20
APPENDIX E Simulation Output Text Files
21
APPENDIX F Original Project Proposal
22
Discrete Event Simulation Project
Proposal Class DSES - 6620 Simulation Modeling
And Analysis Name Kevin Lewelling Date February
17, 2002 To Professor Ernesto Butierrez-Miravete
Background Over the past year, the Super Stop
Shop store on the corner of Skiff St. and Dixwell
Ave. in Hamden, CT has installed two new
self-service systems. The first system was
installed in the deli department and allows
shoppers to place orders using an interactive
touch screen computer system. The second
self-service system allows shoppers to self-serve
themselves through the checkout process. Two
systems have been implemented for the
self-service checkout system. The earliest
system targetted shoppers with 20 items or less.
This system was configured with four checkout
stations with a single customer service associate
located in a central location as shown in Figure
1. Following what appeared to be a successful
trial period, Stop Shop imstalled a new
self-service checkout system, shown in Figure 2,
which was re-oriented to the traditional isle
type configuration. The new system not only has
two isles designated for shoppers with 12 items
or less but also has three new isles that can
accommodate as many groceries as you care to
scan. For the new system, SS has hired two
customer service associates that circulate
between the checkout isles to aid shoppers in
their checkout process. None of the checkout
systems have employees dedicated to bagging
groceries
23
Problem Statement Stop Shop grocery stores
have implemented the use of self-service checkout
lines to reduce operating costs. This is
accomplished by eliminating both a cashier and a
food packaging associate normally required in
each checkout line. Furthermore, by removing the
cashier, who is typically located in part of the
isle, the new self-service checkout systems can
be narrower and therefore require less floor
space. Although the self-service lines process
shoppers a bit slower than the conventional
checkout line, due to shoppers being unfamiliar
with the system and inevitable hang-ups, total
shopper throughput may be increased by being able
to add more checkout lines in the same amount of
space. Stop Shop wants to know if they should
install more self-service checkout lines to
maximize shopper through put based on the floor
space available. The focus of this study will be
to determine the optimum number of self-service
lines required to maximize shopper through put
based on the floor space available in the
checkout area. Approach An initial visit will
be made to the Stop Shop super market to
accurately document the configuration of each
checkout line. A Pro-Model simulation model will
then be created based on the configuration
schematic. A separate visit will be made to
collect arrival and processing data for each
checkout line configuration. This will include
data from both of the full service checkout
lines, 12 items or less and the unlimited lines,
as well as data from both self-service checkout
lines, again 12 items or less and the unlimited
lines. Roughly 1 hour of data will be collected
for each checkout line for a total of 4 hours of
data. Data will be collected on a weekend to
ensure minimal idle time in each of the checkout
lines. A simulation will be run to baseline the
current configuration and to determine the
current maximum customer through put. An
optimization routine will then be run, varying
the number of individual checkout line
configurations, to determine the optimum
combination of full and self-service checkout
lines.
Recommended
