
Allen PowerPoint PPT Presentation
1 / 1
Title: Allen
1
David L. Darling Sandhyarani Patlolla
July, 2003
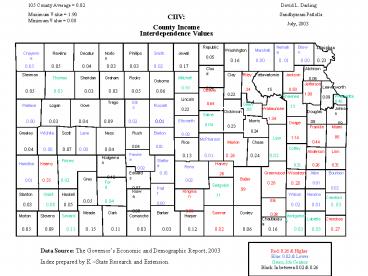
105 County Average 0.02 Maximum Value 1.90
Minimum Value 0.00
CIIV County Income Interdependence Values
Brown
Nemaha
Republic 0.05
Doniphan
Marshall
Washington
Cheyenne
Decatur
Norton
Phillips
Rawlins
Smith
Jewell
0.16 0.00 0. 01
0.00 0.23
0.05 0.05 0.04
0.03 0.03 0.02
0.17
Atchison 0.06
Cloud 0.04
Clay 0.22
Jackson 0.50
Pottawatomie .15
Riley .34
Sherman
Graham
Mitchell 0.10
Rooks
Sheridan
Thomas
Osborne
Jefferson 1.90
Leavenworth 0.09
Ottawa
0.05 0.05 0.03
0.03 0.05 0.06
Shawnee .13
Wyandotte 0.45
0.64
Geary .85
Lincoln 0.22
Ellis
Trego
Gove
Russell
Wallace
Logan
Johnson .09
Wabaunsee 1.34
Dickinson 0.23
Douglas .08
Saline 0.04
0.00 0.03 0.04
0.09 0.02 0.01
Ellsworth
Morris
Osage 1.14
0.24
Franklin 0.44
Miami .86
0. 02
Barton
Greeley
Lane
Rush
Scott
Wichita
Ness
Lyon
McPherson
0.04 0.01
Marion
Chase
Rice
Coffey
0.04 0.00 0.07 0.00
0.04
Anderson
Linn
Pawnee
0.13 0.01 0.26 0.24
0.02
Hodgeman 0.12
0.31 0.26 0.31
Finney
Stafford
0.02
Hamilton
Kearny
Harvey .26
Reno
Allen 0.01
Bourbon 0.02
Edwards 0.07
Greenwood 0.28
Woodson
0. 01
0.02
0.01 0. 35 0. 02
Gray
Butler .99
Ford
0.28
Sedgwick .11
Pratt 0.00
Kingman 0.30
Kiowa 0.08
Grant
Neosho
Stanton
Wilson
Haskell
Crawford
0.05 0.04
Elk
0.02 0.01 0. 03
0.03 0.08 0.05
0.38
Barber
Clark
Cowley
Meade
Sumner
Comanche
Harper
Montgomery
Morton
Seward
Stevens
Chautauqua
Cherokee
Labette
0.05 0.09 0.11 0. 15
0.11 0.03 0.03
0.12 0.82
0.06 0.16 0.05 0.05
0.27
Red 0.26 Higher Blue 0.02 Lower Green Job
Centers Black In between 0.02 0.26
Data Source The Governors Economic and
Demographic Report, 2003 Index prepared by K
State Research and Extension.
Recommended
