
Functional%20Linkage%20of%20Watersheds%20and%20Streams%20(FLoWS): PowerPoint PPT Presentation
Title: Functional%20Linkage%20of%20Watersheds%20and%20Streams%20(FLoWS):
1
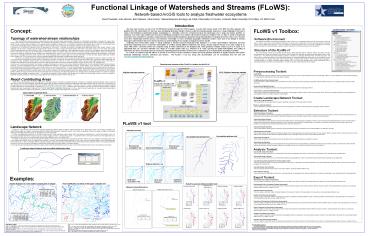
Functional Linkage of Watersheds and Streams
(FLoWS) Network-based ArcGIS tools to analyze
freshwater ecosystems
David Theobald, John Norman, Erin Peterson,
Silvio Ferraz, Natural Resource Ecology Lab,
Dept of Recreation Tourism, Colorado State
University Fort Collins, CO 80523 USA
Introduction We have been involved, as part
of an US EPA-funded project (through the STAR
program), to assist with science needs of US EPA
and other agencies with guidance from the Clean
Water Act. We have been developing landscape
indicators that are useful for predicting aquatic
responses. A large challenge to this type of
study is that traditional experimental designs
(manipulated vs. controlled) cannot be conducted
because the landscapes are so large and human
activities so dominant. As a result, many studies
have focused on identifying correlations of
co-variates with measured response variables.
Here, we hope to assist in the general movement
from correlation to causation, to generate and
examine tenable hypotheses generated using
understanding of ecological processes, and to
move towards more direct relationships between
process and measures. Essentially, we have
developed geographic information systems (GIS)
tools in an attempt to develop landscape-scale
indicators that more closely represent our
understanding of how aquatic ecological processes
operate. Challenges from David Allans
paper A critical challenge to develop improved
landscape-scale indicators is a clearer
representation watersheds and their hierarchical
relationship and to incorporate nonlinearities of
condition among different watersheds and along a
stream segment (Fausch et al. 2002 Gergel et al.
2002 Allan 2004). Commonly metrics are computed
using an entire watershed as the analytical unit,
which generates lumped metrics such as urban
or agricultural land use, yet these estimates
vary widely at a smaller spatial scale (e.g.,
Richards et al. 1996). Ignoring the spatial
heterogeneity and scaling of watersheds has led
to somewhat equivocal conclusions regarding
general proportions of land use in a watershed as
an overall indicator of biological condition.
As a result, our objective with this effort is
to provide a set of tools to assist scientists to
quickly and easily generate indicators of aquatic
response that capture functional relationships
between watershed and streams. The FLoWS v1 tool
box along with documentation can be downloaded
from the web site www.nrel.colostate.edu/projects/
starmap.
Concept
FLoWS v1 Toolbox
FLoWS version 1.0 ToolBox
Typology of watershed-stream relationships
There are a variety of ways that space is
represented and used to generate deeper
understanding of the behavior of watershed and
streams as measured at a given site or location
along a stream or other hydrological feature
site, watershed, distance-base, and network.
Commonly landscape (GIS, remotely-sensed) data
are needed to complement field-based at a site or
location where covariates such as geology,
dominant vegetation, elevation, etc. are
collected to complement field-collected data at a
site (e.g., and EPA EMAP site). Occasionally
covariate data nearby or forming the context of a
site are needed, such as catchment area,
population density, acres of agricultural land
use, etc. A second way is to represent a
landscape in terms of watersheds (or catchments).
Co-variates are summed or averaged within
watersheds (often called lumped models). These
hydrologic units are used to compute some
landscape indicator variable, for example,
average road density (Bolstad and Swank), dam
density (Jones et al. 1997 Moyle and Randall
1998), connected impervious surface (Wang et al.
2001) or total number of dams within a watershed.
These watersheds are often conceived of as
overlapping, hierarchical areas defined from the
pour-point or outlet on up to the headwaters or
watershed boundary. This follows directly from
the River Continuum Concept (Vannote 1980)1,
where river systems are conceived as continuous
gradient of physical conditions from headwaters
to the mouth of a river. Often in practice,
however, typically these watersheds are
tessellations of catchment areas such as
Hydrologic Unit Codes, where only 55 of the
2,150 cataloguing units (so called 8-digit HUCs)
are true watersheds -- the rest are called
adjoint watersheds or interior basins (Seaber
et al. 1987). Moreover, there is not flow
represented between true watersheds and
downstream adjoint watersheds. A
third way is to explicitly examine the spatial
relationships between sites (or locations), which
can then be incorporated into a geostatistical
model (e.g., Ganio et al. 2005). This is most
commonly accomplished by including not only
covariates at a site within a model, but also
measured responses from other nearby sites.
Typically the spatial relationships are measured
by simply straightline distance (as the crow
flies) between points (e.g., Olden et al. 2001).
Increasingly, distance along the hydrological
network (as the fish swims) is computed. Note
that both of these are Euclidean (or assume a
flat, 2D plane) distances, and hence Euclidean
distance, though commonly used, is an ambiguous
term. A fourth way is to conceive and represent
river systems and aquatic landscapes as a
network. In this sense, relationships between
sites can be represented through functional
distance measures. For many hydrological
processes (not all!) downstream flow direction is
an important ecological process, so that distance
is not symmetric. Also, including important
landscape attributes that modify the degree to
which nearby locations are connected is
important. This would include topographic
considerations such as stream gradient and slope,
as well as features that might impede the
movement of a species or process such as
waterfalls, dams, or certain vegetation types.
Representing functional relationships can be done
within a network, to recognize that physical
conditions along a river are often controlled by
the network geometry of the river system (Benda
et al. 2004). One consequence of this interplay
between pattern and process is the form of
functional connectivity found in a landscape. The
landscape pattern-process linkage produces
spatial dependencies in a variety of ecological
phenomena, again mediated by organismal traits.
It is through the integration of these features
of landscapes and of organisms that landscape
ecology can offer new insights to freshwater
ecologists, fostering a closer linking of spatial
patterns with ecological processes (Wiens 2002,
pg. 511).
Software Environment The software was
written as a Geoprocessing toolbox, written in
Pyton (v2.1) and tested using ArcGIS v9, Service
pack 3. Nearly all tools in FLoWs require only
ArcGIS desktop (no extensions). Only two tools
(Create RCAs and Fill DEM and Build Flow
Direction Raster) require Spatial Analyst
extension. If you are creating any landscape
network (which is a personal Geodatabase), an
ArcINFO license is required. The other tools
(query, selection, analysis, export, etc.) can
function with just an ArcView license. Structure
of the FLoWs v1 The FLoWs toolbox consists
of five toolsets pre-processing create
landscape network selection analysis and
export. The pre-processing toolset contains
miscellaneous tools that are useful in editing
and converting raw datasets into appropriate
inputs for other FLoWs tools. The selection
tools allow interactive queries or selections on
Landscape Networks within an ArcMap document.
This allows users to create new selection set
that represents upstream or downstream
topological relationships to be summarized or
used in further analysis. The analysis tools
allow users to perform graph or network-based
analyses. These routines typically populate a
user-defined field for a defined Landscape
Network feature class. The export tools evaluate
point to point relationships within a Landscape
Network and create a comma delimited n x n matrix
of distance values between pairs of locations.
Flowchart and structure of the FLoWS v1 toolbox
for ArcGIS v9.
Pre-processing Toolset Create RCAs This tool
generates a polygon shapefile of Reach Catchment
Areas (RCAs) for every unique polyline within an
input hydrologic network. An RCA represents a
sub-component (polygon) of a watershed that
drains directly into a given stream segment.
Fill DEM and Build Flow Direction Raster This
tool processes a DEM and based on a user-defined
fill z-limit value (to fill in pits) to
generate a filled DEM and flow direction raster.
This is a preprocessing tool for the Create RCAs
tool. Reverse Flow (Digitized) Direction This
tool reverses the digitized direction of the
input polyline features that represent a
hydrologic network. Snap Points to Landscape
Network Edges This tool allows features
represented by points (such as dams, stream
gages, sample locations, point-source pollution,
mines, etc) to be incorporated into the Landscape
Network by associating each point to an edge via
dynamic segmentation. Create Landscape Network
Toolset Polyline to Landscape Network This tool
generates a Landscape Network based on geometric
coincidence of the input polyline features.
RCAs to Landscape Network This tool generates a
Landscape Network for RCAs based on geometric
coincidence of the input polyline (hydrologic
network) features. Selection Toolset Select
Downstream Cumulative This tool adds features to
the selected set that are downstream from the
selected features (as defined in ArcMap). The
user needs to define a numeric field and a
threshold value such that features will be
included in the selection if downstream features
have a cumulative value less than or equal to the
threshold value. Select Downstream
Features This tool adds features to the selected
set that are downstream from the selected
features (as defined in ArcMap). Like the Select
Downstream Mainstem tool, this tool adds features
that are directly downstream (along the
mainstem), but also features that are upstream of
added features. For example, all mainstem and
tributary reaches below a dam can be identified
(assuming the initial selected feature represents
a reach with a dam on it). Select Downstream
Mainstem This tool adds features to the selected
set that are (strictly) downstream along the
mainstem from the selected features (as defined
in ArcMap). Select Upstream Cumulative This
tool adds features to the selected set that are
upstream from the selected features (as defined
in ArcMap). The user needs to define a numeric
field and a threshold value such that features
will be included in the selection if upstream
features have a cumulative value less than or
equal to the threshold value. Select Upstream
Features This tool adds all features to the
selected set that are upstream from the selected
features (as defined in ArcMap). Select
Upstream Mainstem This tool adds mainstem
features to the selected set that are upstream
from the selected features (as defined in
ArcMap). The user needs to define a numeric field
so that mainstem features are defined by finding
the largest upstream accumulated value at each
confluence upstream from the initial
selection. Analysis Toolset Accumulate Values
Downstream This tool accumulates values from a
user-defined field downstream and populates the
values of a new field for each feature with its
downstream accumulated value. Accumulate
Values Upstream This tool accumulates values
from a user-defined field upstream and populates
the values of a new field for each feature with
its upstream accumulated value. Calculate
Downstream Distance From Points to Basin
Outlet This tool calculates the distance (along
the mainstem) from each point in a drainage to
its outlet and populates a user-defined field
with the distance value. Points must be
coincident (snapped) on a network line.
Calculate Stream Order (Strahler) This tool
calculates Strahler stream order for each reach
within a Landscape Network feature class. Check
Network Topology This tool searches the node
feature classes for a Landscape Network for
topological errors based on geometric coincidence
and populates a user-defined field with node
designations. Export Toolset Downstream Only
Distance (Asymmetric) This tool creates an
asymmetric matrix of downstream-only distances
from all pairs of points in the input feature
class based on a Landscape Network feature
class. Downstream Portion of Instream Distance
(Asymmetric) This tool creates an asymmetric
matrix that provides only the downstream portion
of the instream distance between all pairs of
points in the input feature class based on a
Landscape Network feature class (e.g., edges or
RCAs). Instream Distance (Symmetric) This tool
creates a symmetric matrix of instream distances
from all pairs of points in the input feature
class based on a Landscape Network feature
class. Number of Confluences (Symmetric) This
tool creates a symmetric matrix that computes the
number of confluences between between all pairs
of points (upstream and downstream) in the input
feature class based on a Landscape Network
feature class (e.g., edges or RCAs). Proportion
of Downstream Only Distance (Asymmetric) This
tool creates an asymmetric matrix that provides
the downstream proportion (or percent) of the
total instream distance between all pairs of
points in the input feature class based on a
Landscape Network feature class (e.g., edges or
RCAs). Ratio of Upstream to Downstream
(Asymmetric) This tool creates an asymmetric
matrix that provides the ratio of the upstream to
downstream distance between all pairs of points
in the input feature class based on a Landscape
Network feature class (e.g., edges or RCAs).
Straight Line Distance (Symmetric) This tool
creates a symmetric matrix that provides the
straightline distance (computed in map units)
between all pairs of points in the input feature
class based on a Landscape Network feature class
(e.g., edges or RCAs). Upstream Only Distance
(Asymmetric) This tool creates an asymmetric
matrix of upstream-only distances from all pairs
of points in the input feature class based on a
Landscape Network feature class (e.g., edges or
RCAs).
RCA / Polyline Landscape network
Polyline landscape network
Reach Contributing Areas Rather than using
overlapping, hierarchical watersheds in
hydrologic analysis, we employ a hydrologic
framework composed of a complete, detailed
tessellation of reach catchment areas (RCAs).
RCAs are non-overlapping, edge-matching polygons
that are drawn to that their boundaries include
nearby areas that would likely flow into a given
reach. For example, we have generated RCAs for
reaches defined in the USGS National Hydrography
Dataset (at medium resolution, 1100,000). In the
NHD, a reach is defined usually as a significant
segment of surface water that has similar
hydrologic characteristic (http//nhd.usgs.gov/cha
pter1/index.html). A transport reach is
delineated by lines that are oriented in the flow
direction. Note that branched path reach is
generated to represent the 1D flow of water
through a waterbody. Operationally in a GIS, a
reach is typically represented as a polyline
feature representing a unique head-to-confluence,
confluence-to-confluence, confluence-to-mouth, or
head-to-mouth segment in a river network.
FLoWS v1 tool
Landscape Network A network is a data
structure used to represent topological
relationships between objects or features.
Networks typically rely on graph theory, where a
set of nodes (or locations) are related through
edges (or linkages). A landscape network
(Theobald 2005) represents a geometric network,
which stores the geometry of nodes and edges in
addition to topological adjacencies. Note that
edges are directed, so hydrologic flow can be
represented. In ESRIs Geodatabase
architecture at v8, this type of data structure
is called a geometric network (Zeiler 1999), and
edges are represented as a 1-dimensional
polyline, which can be a simple straightline
between two nodes or may be a complex wiggly
line (with gt2 vertices) like a stream. In a
geometric network, the location where two or more
edges intersect is represented by a node, which
has a spatial location and associated attributes
such as area (Zeiler 1999). We began by
developing FLoWs around the geometric network,
but we found it was cumbersome to automatically
generate networks from our shapefiles of
hydrology and for most of our analyses did not
make use of the supplied solver methods. As a
result, we eventually opted to generate our own,
open, and more simplified network using a
ForwardStar data structure (Ahuja et al. 1993). A
landscape networks topology is defined by
geometric coincidence of from/to nodes, and the
polylines that connect the nodes can be represent
geometry and can also cross (be non-planar). Note
that we represent just simple edges (not complex
edges of Geometric Network). For example, the
figure and table below represents a graph, where
nodes are represented by numerical values. Note
that the relationship table records are ordered
by from feature.
Selection set tools
Accumulate upstream tool
Accumulate downstream tool
Examples
Flow modification via Dams in the Upper Colorado
river
Stream distances for Coho Salmon sample plots in
Oregon
Export to pair-wise distance matrix tools
Network connectivity errors
Literature cited
Moyle, P.B. and P.J. Randall. 1998. Evaluating
the biotic integrity of watersheds in the Sierra
Nevada, California. Conservation Biology.
121318-1326. Olden, J., D.A. Jackson, and P.R.
Peres-Neto. 2001. Spatial isolation and fish
communities in drainage lakes. Oecologia 127
572-585. Seaber, P.R., F.P. Kapinos, and G.L.
Knapp. 1987. Hydrologic Unit Maps. US Geological
Survey Water-Supply Paper 2294. Vannote, R.L.,
G.W. Minshall, K.W. Cummins, J.R. Sedell, and
C.E. Cushing. The river continuum concept.
Canadian Journal of Fisheries and Aquatic Science
37 130-137. Wiens, J. 2002. Riverine landscapes
taking landscape ecology into the water.
Freshwater Biology 47 501-515. Zeiler, M. 1999.
Modeling our world The ESRI guide to geodatabase
design. Redlands, CA ESRI Press.
Funding/Disclaimer The work reported here
was developed under the STAR Research Assistance
Agreement CR-829095 awarded by the U.S.
Environmental Protection Agency (EPA) to Colorado
State University. This presentation has not been
formally reviewed by EPA. The views expressed
here are solely those of the presenter and
STARMAP, the Program (s)he represents. EPA does
not endorse any products or commercial services
mentioned in this presentation.
Ahuja, R.K., T.L. Magnanti, and J.B. Orlin. 1993.
Network flows Theory, algorithms, and
applications. Prentice-Hall Upper Saddle River,
New Jersey. Benda, L., N.L. Poff, D. Miller, T.
Dunne, G. Reeves, G. Pess, and M. Pollock. 2004.
The Network Dynamics Hypothesis how channel
networks structure riverine habitats.
BioScience 54(5) 413-427. Ganio, L.M., C.E.
Torgersen, and R.E. Gresswell. 2005. A
geostatistical approach for describing spatial
pattern in stream networks. Frontiers in Ecology
and Environment 3(3) 138-144. Jones, K.B.,
K.H. Ritters, J.D. Wickham, R.D. Tankersley, Jr.,
R.V. ONeill, D.J. Chaloud, E.R. Smith, and A.C.
Neale. An Ecological Assessment of the United
State Mid-Atlantic Region A Landscape Atlas.
US Environmental Protection Agency,
EPA/600/R-97/130.
Recommended
