
Measuring Ultrashort Laser Pulses III: Interferometric Techniques PowerPoint PPT Presentation
1 / 54
Title: Measuring Ultrashort Laser Pulses III: Interferometric Techniques
1
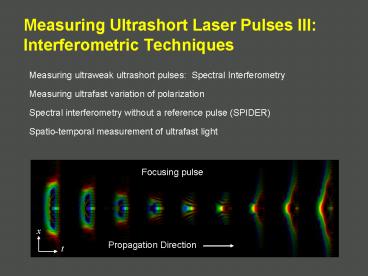
Measuring Ultrashort Laser Pulses III
Interferometric Techniques
Measuring ultraweak ultrashort pulses Spectral
Interferometry Measuring ultrafast variation of
polarization Spectral interferometry without a
reference pulse (SPIDER) Spatio-temporal
measurement of ultrafast light
Focusing pulse
x
Propagation Direction
t
2
Sensitivity of FROG
1 microjoule 10-6 J 1 nanojoule 10-9
J 1 picojoule 10-12 J 1 femtojoule 10-15
J 1 attojoule 10-18 J
Assumes multi-shot measurement of 800nm 100fs
pulses at 100MHz rep rate.
3
Spectral Interferometry
Froehly, et al., J. Opt. (Paris) 4, 183
(1973) Lepetit, et al., JOSA B, 12, 2467
(1995) Fittinghoff, et al., Opt. Lett., 21, 884
(1996). C. Dorrer, JOSA B, 16, 1160 (1999)
Measure the spectrum of the sum of a known and
unknown pulse. Retrieve the unknown pulse E(w)
from the cross term.
1/T
This involves no nonlinearity!
T
Eunk
Frequency
Eref
Eref
Eunk
Spectrometer
Camera
Beam splitter
With a FROG-measured reference pulse, this
technique is known as TADPOLE (Temporal Analysis
by Dispersing a Pair Of Light E-fields).
4
Retrieving the pulse in spectral interferometry
The DC term contains only spectra
The AC terms contain phase information
Interference fringes in the spectrum
FFT
Time
0
Filter out these two peaks
Filter Shift
IFFT
Phase
Keep this one.
Intensity
Time
0
This retrieval algorithm is quick, direct, and
reliable. It essentially uniquely yields the
pulse.
Froehly, et al. 1972 Lepetit, et al. 1995
Fittinghoff, et al. 1996.
5
Spectral interferometry of continuum
6
Sensitivity of Spectral Interferometry (TADPOLE)
1 microjoule 10-6 J 1 nanojoule 10-9
J 1 picojoule 10-12 J 1 femtojoule 10-15
J 1 attojoule 10-18 J
7
Application of spectral interferometry
Phase mapping of ultrashort pulses in bimodal
photonic structures A window on local group
velocity dispersion H. Gersen, E. M. H. P. van
Dijk, J. P. Korterik, N. F. van Hulst, and L.
Kuipers, PHYSICAL REVIEW E 70, 066609 (2004)
8
Spectral Interferometry Experimental Issues
The interferometer is difficult to work with.
Mode-matching is importantor the fringes wash
out.
Phase stability is crucialor the fringes wash
out.
Unknown
Spectrometer
Beams must be perfectly collinearor the fringes
wash out.
To resolve the spectral fringes, SI requires at
least five times the spectrometer resolution.
9
SEA TADPOLE
Spatially Encoded Arrangement (SEA) SEA TADPOLE
uses spatial, instead of spectral, fringes.
And any and all distortions due to the fibers
cancel out!
10
Retrieve the pulse using spatial fringes, not
spectral fringes, with near-zero delay.
The beams cross, so the relative delay, T, varies
with position, x.
1D Fourier Transform from x to k
The delay is zero, so this uses the full
available spectral resolution!
11
SEA TADPOLE theoretical traces
(mm)
(mm)
12
More SEA TADPOLE theoretical traces
(mm)
(mm)
13
SEA TADPOLE measurements
SEA TADPOLE has enough spectral resolution to
measure a 14-ps double pulse.
14
An even more complex pulse
An etalon inside a Michelson interferometer
yields a double train of pulses, and SEA TADPOLE
can measure it, too.
15
SEA TADPOLE achieves spectral super-resolution!
Blocking the reference beam yields an independent
measurement of the spectrum using the same
spectrometer.
The SEA TADPOLE cross term is essentially the
unknown-pulse complex electric field. This goes
negative and so may not broaden under convolution
with the spectrometer point-spread function.
16
SEA TADPOLE spectral super-resolution
When the unknown pulse is much more complicated
than the reference pulse, the interference term
becomes
Sine waves are eigenfunctions of the convolution
operator.
17
SEA TADPOLE for a complex shaped pulse
A complex pulse, generated using a pulse shaper
Pulse generated and measured by Matthew Coughlan
and Robert Levis, Temple University
18
Unpolarized light doesnt exist
...there is, however, light whose polarization
state changes too rapidly to be measured with the
available apparatus!
So measure E(t) for both polarizations using two
SI apparatuses
Eunk
Eref
V
ertical
polarization
Spectrometer
Camera
Horizontal
polarization
Polarizers
Camera
Spectrometer
Walecki, Fittinghoff, Smirl, and Trebino, Opt.
Lett. 22, 81 (1997)
19
Application of POLLIWOG
Measurement of the variation of the polarization
state of the emission from a GaAs-AlGaAs multiple
quantum well when heavy-hole and light-hole
excitons are excited elucidates the physics of
these devices.
Excitation-laser spectrum and hh and lh exciton
spectra
Evolution of the polarization of the emission
time (fs)
A. L. Smirl, et al., Optics Letters, Vol. 23, No.
14 (1998)
20
Spectral Interferometry Pros and Cons
- Advantages
- Its simplerequires only a beam-splitter and a
spectrometer - Its linear and hence extremely sensitive. Only a
few - thousand photons are required.
- Disadvantages
- It measures only the spectral-phase difference.
- A separately characterized reference pulse is
required to - measure the phase of a pulse.
- The reference pulse must be the same color as the
- unknown pulse.
- It requires careful alignment and good
stabilityits an - interferometer (but SEA TADPOLE fixes this).
21
Using spectral interferometry to measure a pulse
without a reference pulse SPIDER
If we perform spectral interferometry between a
pulse and itself, the spectral phase cancels out.
Perfect sinusoidal fringes always occur
What if we frequency shift one pulse replica
compared to the other
group delay
frequency shear
pulse separation
This measures the derivative of the spectral
phase (the group delay). This technique is
called Spectral Phase Interferometry for Direct
Electric-Field Reconstruction (SPIDER).
Iaconis and Walmsley, JQE 35, 501 (1999).
22
How SPIDER works
.
Input pulses
Output pulses
Chirped pulse
Two replicas of the pulse are produced, each
frequency shifted by a different amount.
t
This pulse sums with the green part of the
chirped pulse.
This pulse sums with the blue part of the chirped
pulse.
T
T
t
t
SFG
Double pulse
Performing SI on these two pulses yields the
difference in spectral phase at nearby
frequencies (separated by dw). This yields the
spectral phase.
23
SPIDER apparatus
Michelson Interferometer
Pulse to be measured
Variable delay
Camera
SHG crystal
Spec- trom- eter
Variable delay
SPIDER yields the spectral phase of a
pulseprovided that the delay between the pulses
is larger than the pulse length and the resulting
frequency fringes can be resolved by the
spectrometer.
Pulse Stretcher
Grating
Grating
24
SPIDER extraction of the spectral phase
Extraction of the spectral phase
L. Gallmann et al, Opt. Lett., 24, 1314 (1999)
Measurement of the interferogram
Extraction of their spectral phase difference
using spectral interferometry
Integration of the phase
Frequency domain
Time domain
25
Advantages and Disadvantages of SPIDER
Advantages Pulse retrieval is direct (i.e.,
non-iterative) and hence fast. Minimal data are
required only one spectrum yields the spectral
phase. It naturally operates single-shot. Disad
vantages Its apparatus is very complicated.
It has 12 sensitive alignment parameters
(5 for the Michelson 4 in pulse stretching 1
for pulse timing 2 for spatial overlap
in the SHG crystal not counting the
spectrometer). Like SI, it requires very high
mechanical stability, or the fringes wash
out. Poor beam quality can also wash out the
fringes, preventing the measurement. It has no
independent checks or feedback, and no marginals
are available. It cannot measure long or
complex pulses TBP lt 3. (Spectral resolution
is 10 times worse than that of the
spectrometer due to the need for fringes.) It
has poor sensitivity due to the need to split and
stretch the pulse before the nonlinear
medium. The pulse delay must be chosen for the
particular pulse. And pulse structure can
confuse it, yielding ambiguities.
26
Can we simplify SPIDER?
SPIDER has 12 sensitive alignment degrees of
freedom.
Pulse to be measured
Michelson Interferometer
5 alignment parameters (q, f for each BS and
delay)
Variable delay
Camera
SHG crystal
Spec- trom- eter
Variable delay
Pulse Stretcher
4 alignment parameters q (q for each grating
and q, f for the mirror)
Grating
3 alignment q parameters q (q, f for a mirror and
q delay) q
What remains is a FROG!!!
Grating
27
How NOT to make a SPIDER measurement
Remember that a separate measurement of the
spectrum is required. Step 1 Align laser for
flattest spectral phase. Step 2 Make a SPIDER
measurement of the spectral phase. Step 3
Align laser for broadest spectrum. Step 4
Measure spectrum with a spectrometer. If you do
this, youve just cheated! Youve measured the
spectrum of one pulse and the spectral phase of
another! You have to measure both the spectrum
and spectral phase of the same pulse, that is. At
the same time or at least without touching the
laser between the measurements!!!
28
More ways NOT to make a SPIDER measurement
Remember that a separate measurement of the
spectrum is required. Step 1 Align laser for
flattest spectral phase. Step 2 Make a SPIDER
measurement of the spectral phase. Step 3
Align laser for the broadest ASE (amplified
spontaneous emission) background or average a
fine-structured jittery spectrum over many shots
to smear it out. Step 4 Measure spectrum with
a spectrometer. Again, if you do this, youve
just cheated! Youve measured the spectrum of
one pulse and the spectral phase of another! You
have to measure both the spectrum and spectral
phase of the same pulse, that is, at the same
time or at least without touching the laser
between the measurements!!!
29
Accuracy of SPIDER
Recall the pulse spectral phase expansion
The spectral phases key term is the quadratic
one, j2 (the linear chirp). Its the linear term
in the SPIDER phase because SPIDER measures the
derivative of the pulse phase. But theres
another linear term in the SPIDER phase, wT, due
to the double-pulse separation, T, which has
precisely the same effect on the SPIDER trace
Assuming only linear chirp and ignoring
higher-order terms
frequency shear
pulse separation
30
Accuracy of SPIDER
Recall that j 2 (w - w0) is just the group delay
(arrival time), tgr, of the frequency w
So its critical to be able to measure tgr with
accuracy much better than one pulse length, tp.
So lets get an idea of the magnitudes of the
numbers involved
The uninteresting term, wT, heavily dominates (by
105) the term we care about, dw tgr.
31
SPIDER accuracy (contd)
The group delay errors at the maximum and minimum
frequencies in the pulse spectrum are then
The error in the pulse length is then the
difference between these two group-delay errors
pulse bandwidth
or
frequency shear
In terms of ratios
The accuracy of the separation must be lt10-5, and
really 10-6! This is typically only a few
attoseconds!
100 x 100 x
32
Spatio-temporal intensity-and-phase measurement
Why?
Spatial distortions in stretchers/compressors. Pul
se front distortions due to lenses. Structure of
inhomogeneous materials. Pulse propagation in
plasmas and other materials Anything with a beam
that changes in space as well as time!
33
Measuring the Intensity and Phase vs. Time and
Space
Spectral interferometry only requires measuring
one spectrum. Using the other dimension of the
CCD camera for position, we can measure the
pulse along one spatial dimension, also.
??
Microscope Slide
Fringe spacing is larger due to delay produced by
slide (ref pulse was later).
Without Slide
34
Scanning SEA TADPOLE E(x,y,z,t)
The spatial resolution is determined by the
spatial mode of the fiber.
By scanning the input end of the unknown-pulse
fiber, we can measure E(w) at different positions
yielding E(x,y,z,?). So we can measure even
focusing pulses!
Pam Bowlan
35
E(x,z,t) for a theoretically perfectly focused
pulse.
E(x,z,t)
Simulation
Pulse Fronts
Color is the instantaneous frequency vs. x and t.
Uniform color indicates a lack of phase
distortions.
36
Measuring E(x,z,t) for a focused pulse.
Aspheric PMMA lens with chromatic (but no
spherical) aberration and GDD. f 50 mmNA 0.03
Measurement
810 nm
Simulation
790 nm
37
Spherical and chromatic aberration
Singlet BK-7 plano-convex lens with spherical and
chromatic aberration and GDD. f 50 mmNA 0.03
Measurement
Simulation
810 nm
790 nm
38
Distortions are more pronounced for a tighter
focus.
Experiment
Singlet BK-7 plano-convex lens with a shorter
focal length. f 25 mmNA 0.06
814 nm
Simulation
787 nm
39
Focusing a pulse with spatial chirp and
pulse-front tilt.
Experiment
Aspheric PMMA lens. f 50 mmNA 0.03
812 nm
Simulation
790 nm
40
Measurements of microscope objectives using an
NSOM tip
10X NA .25
The spot size at the focus is 4µm.
789 nm
20X NA .45
817 nm
The spot size at the focus is 2µm.
Some radially varying GDD is present.
41
The focus of an SF11 plano-convex lens
NA .28
Experiment
789 nm
817 nm
Simulation
42
A fore-runner pulse
Overfilling of the lens and chromatic aberration
cause an additional fore-runner pulse ahead of
the main pulse.
Experiment
Simulation
789 nm
817 nm
NA 0.4
43
Holography
Measure the integrated intensity I(x,y) of the
sum of known and unknown monochromatic
beams. Extract the unknown monochromatic field
E(x,y) from the cross term.
44
Frequency-Synthesis Holography for complete
spatio-temporal pulse measurement
Performing holography using a monochromatic beam
yields the full spatial intensity and phase at
the beams frequency (w0)
Performing holography using a well-characterized
ultrashort pulse and measuring a series of
holograms, one for each frequency component,
yields the full pulse in the space-frequency
domain.
E(x,y,t) then acts as the initial condition in
Maxwells equations, yielding the full
spatio-temporal pulse field E(x,y,z,t). This
approach is called Fourier-Synthesis Holography.
45
STRIPED FISH E(x,y,t) on one shot
46
The band-pass filter spectrally resolves the
digital holograms
Side view
Top view
47
Ideal STRIPED FISH trace
48
STRIPED FISH Retrieval algorithm
49
Typical STRIPED FISH measured trace
50
Measurements of the spectral phase
Group delay
Group-delay dispersion
51
Results for a pulse with spatial chirp
Contours indicate beam profile
Reconstructed intensity for a few wavelengths
? 782 nm ? 806 nm
? 830 nm
Reconstructed phase at the same wavelengths
? 782 nm ? 806 nm
? 830 nm
(wrapped phase plots)
52
A pulse with temporal chirp, spatial chirp, and
pulse-front tilt.
Suppressing the y-dependence, we can plot such a
pulse
where the pulse-front tilt angle is
53
Complete electric field reconstruction
Pulse with horizontal spatial chirp
54
Complete 3D profile of a pulse with temporal
chirp, spatial chirp, and pulse-front tilt
797 nm
775 nm
Dotted white lines contour plot of the intensity
at a given time.
55
The Space-Time-Bandwidth Product
How complex a pulse can STRIPED FISH measure?
- After numerical reconstruction, we obtain data
cubes E(x,y,t) that are - 200 by 100 pixels by 50 holograms.
Space-Bandwidth Product (SBP)
Time-Bandwidth Product (TBP)
Space-Time-Bandwidth Product (STBP)
STRIPED FISH can measure pulses with STBP 106
1/10 the number of camera pixels.
56
Frontiers in Ultrashort-Pulse Measurement
f0 0 f0 p
Attosecond-pulse measurement Absolute-phase
measurement
Light-pulse measurement Self-referenced
ultraweak-pulse measurement
57
To learn more, visit the FROG web sites
www.physics.gatech.edu/frog
www.swampoptics.com
And if you read only one ultrashort-pulse-measurem
ent book this year, make it this one!
Recommended
