
THE UC DAVIS BIOSENTINEL PowerPoint PPT Presentation
1 / 65
Title: THE UC DAVIS BIOSENTINEL
1
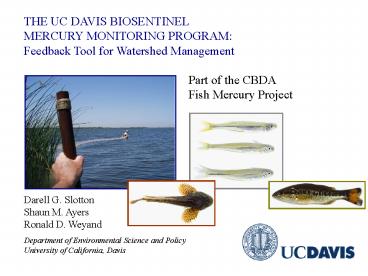
THE UC DAVIS BIOSENTINEL MERCURY MONITORING
PROGRAM Feedback Tool for Watershed Management
Part of the CBDA Fish Mercury Project
Darell G. Slotton Shaun M. Ayers Ronald D. Weyand
Department of Environmental Science and
Policy University of California, Davis
2
Biosentinel Mercury Monitoring
Using small, young fish as localized,
time-sensitive measures of methylmercury
exposure
Key element of the CBDA Mercury Strategy
Techniques refined by UC Davis since 1985
substantial investment by CalFed in 3 projects
Demonstrated linkage to both aqueous and large
fish MeHg
A relatively consistent, fish-based measure
of net exposure, after MeHg has diffused out
of the sediment and interacted with local
conditions
Spatial patterns to a local scale
Interannual trends and variability
Within-year seasonal trends
Performance measures for restoration and
remediation
3
Biosentinel Morning Session Presentation
Overview
4
Biosentinel Program Goals and Objectives
Develop baseline data and ongoing performance
data at major restoration and remediation sites.
Seasonal trends and inter-species relationships
at a subset of sites.
Help define conditions leading to greater or
lesser levels of methylmercury exposure to fish.
Track spatial and inter-annual trends in biotic
mercury, at project sites as well as across the
system.
Refine the use of biosentinels as reliable
feedback tools.
5
Hypotheses / Questions
6
(No Transcript)
7
Entire Biosentinel Monitoring Region
App. 50 sites/year
11 of these also sampled seasonally in 2006
multi- species intensive work
App. 4,000 individual small fish analyses/yr
Feedback to restoration and watershed
managers draws from entire program
8
Central Project Area Primary Species Mississippi
Silverside (Menidia audens)
9
Fall 1999 UC Davis Silversides
Established clear, regional pattern elevated
periphery, lower central
Silversides ideal biosentinels widespread
consistent Hg trends site-specific
End of warm, active season
Main cohort grown to sampling size
Stable period hydrologically
10
Primary Species in Salmon Restoration
Areas Prickly Sculpin (Cottus asper)
Merced River Tuolumne River Clear
Creek (Sacramento River) (San Joaquin River,
Vernalis)
11
Primary Species in parts of the Delta where
sculpin and silversides are scarce or
absent Juvenile Largemouth Bass (Micropterus
salmoides)
Big Break / Dutch Slough South Delta Dead
Horse Slough (Franks Tract) (Cosumnes
River) (San Joaquin River) (Sacramento River)
12
Spatial Distribution of Primary Biosentinels
13
Some Secondary Species Across Central Region
Threadfin Shad (Dorosoma petenense)
Oriental Shrimp (Palaemon macrodactylus)
Golden Shiner (Notemigonus crysoleucas)
Bluegill and Redear Sunfish (juv) (Lepomis
macrochirus, microlophus)
14
Biosentinel Sampling Techniques
15
Biosentinel Sampling Techniques
16
Multiple Individual Fish Analyses (n 30)
Within pre-defined size ranges with consistent
Hg
(Franks Tract, July 2006)
Strong statistical power Detailed individual
information
Weight of evidence approach with other
small fish, as available
17
Ability to detect outliers
18
Shotgun scatter patterns may indicate mixing of
individuals from varying exposure areas or
microhabitats
19
SizeHg relationships apparent in individual
data Largemouth Bass
Juvenile bass data size-normalized, based on
trend in 30 individuals
20
Declining Hg trend with size indicates increasing
recent exposure Largemouth Bass at Middle River
21
Distinguish cases of mixed populations
Threadfin Shad in Cosumnes River
22
Yolo Bypass and North Delta Sites
Yolo Bypass Wildlife Area
23
Very high levels in Bypass wetland ponds
Elevated in adjacent Toe Drain (both sites)
but 50 lower
68 lower in Prospect Slough
24
Yolo Bypass and North Delta Silverside Mercury
Trend, Fall 2005 and Fall 2006
Sac. River Mile 44
Residual elevated exposure downstream, long
after flooding-related events
25
Napa-Sonoma Marsh and Petaluma River Region
26
North Bay Silverside Mercury Trend, Fall 2005
Example of biosentinel spatial differentiation
of methylmercury exposure, interannual trends,
and a low example restoration zone
27
Suisun Marsh Region (from 2004 Suisun Marsh
Bay-Delta Consortium, 2004)
Suisun Slough
Montezuma Slough
28
Suisun Marsh Mississippi Silverside Mercury
Trend, Fall 2005
Suisun Slough
Back Spring Branch
2006 elevations confined to Suisun Marsh
Montezuma Slough
29
63
Mud Slough Region, Southern San Joaquin
Mud Slough highly elevated
Salt Sl elevated less, variable
Silverside Hg attenuated by Vernalis, 50 mi
downstream
San Joaquin River
Upper San Joaquin
Mud Slough
Kesterson and other wildlife refuges, wetlands
Salt Sl
30
Mud Slough Region, Southern San Joaquin
Vernalis Intensive
214 increase
Juvenile largemouth bass Hg spatial trend, Fall
2005
, 2006
San Joaquin River
Hg size-normalized to 85 mm, from n30 per sample
Upper San Joaquin
Mud Slough
Kesterson and other wildlife refuges, wetlands
Salt Sl
31
Silversides not collectible at M-W, but good
collections of juvenile bass and sculpin (2006)
32
Location of the Dutch Slough Restoration (from
Dutch Slough Restoration web site)
Marsh Creek
Among lowest silversides concentrations in
entire watershed statistically lower at Marsh
Creek site
No silversides in Emerson Slough, but good
collections of juvenile bass bass lowest again
at Marsh Creek site.
33
Clear Creek Region (TetraTech graphic)
Sacramento River
Dredge Tailings
Clear Creek
34
Prickly Sculpin Regional Mercury Trends
Merced Relatively elevated
Merced River
Sac R. RM44
Tuolumne River
Clear Creek
Sac R. Hamilton City
35
Sacramento River Sculpin Mercury Series, Fall
2006
Ham. City (100 mi)
Feather R
Sculpin data suggest Colusa Drain as a source
of MeHg
Colusa Drain
Cache Ck
Yolo Bypass
American River
Putah Ck
RM 44
36
Sacramento River Sculpin Mercury Series, Fall
2006
37
Sacramento River Sculpin Mercury Series, plus
Dead Horse Slough and Vernalis for context
Strong, residual signal, months
after flooding-related exposure events
38
Silverside Fall 2005 Mercury Spatial
Distribution Entire CBDA Range With Silversides
High spots Yolo Bypass, Cosumnes, Mud Sl
Lower in Delta and Delta exit, rising west
Consistent trends, low variability
39
Silverside Fall 2006 Mercury Spatial
Distribution, following high runoff and flooding
winter and spring
Cosumnes, Mud Sl, Bypass still high
Rivers up, whole Delta up, high variability
region
Delta exit again low, W sites unrelated,
low variability, Napa Marsh down, Petaluma high
40
Silverside Fall 2005 Mercury Spatial
Distribution Entire CBDA Range With Silversides
Yolo Bypass Ponds
Cos- umnes
Peta- luma
Mud Sl
Napa-Son. Marsh
N Delta Tracts
Suisun Marsh
Central Delta
41
Silverside Fall 2006 Mercury Spatial
Distribution, following high runoff and flooding
winter and spring
Wide apparent flood effect, through W Delta
Cos- umnes
Petaluma Marsh
Suisun Marsh
Yolo Bypass
Mud Sl
Napa- Sonoma Marsh
42
Silverside Mercury Year-on-Year Change, as a
Percentage
Widespread, residual flood effect
Declines in Napa Marsh
No change at Black John Sl.
(90 mi)
(40 mi)
43
Juvenile Bass Year-on-Year Data
545 ng/g
Widespread, residual flood effect in a more
long-term sentinel species
(90 mi)
(40 mi)
44
Seasonal Studies
Intensive Sites
45
Seasonal Studies 2006
Sacra- mento River
Grizzly Bay
San Pablo Bay
Suisun Bay
San Joaquin River
Honker Bay
Biotic rises followed large aqueous MeHg
pulses documented upstream
Historically high flood flows, spring snowmelt
Historically high flood flows, winter rain
runoff
46
Suisun Marsh Pre-Runoff/Flooding
Increases Suisun Slough North, Oct-05 Feb-06
47
Juvenile Largemouth Bass Seasonal Trend At Three,
Diverse Intensive Sites
Long-lasting, residual flood effect in a more
long-term sentinel species
Confirmation of spatial pattern seen in
shorter-term silversides
48
Intensive Sites, Multiple Species Data Prospect
Slough (N Delta)
November, 2005
Identified trends were consistent across many
species
49
Intensive Sites, Multiple Species Data Prospect
Slough (N Delta)
February, 2006
Silversides jumped up by February
50
Intensive Sites, Multiple Species Data Prospect
Slough (N Delta)
May, 2005
Entire range of species up significantly in May
51
Intensive Sites, Multiple Species Data Prospect
Slough (N Delta)
July, 2006
By July, new crops of young fish at
near-baseline levels exposure down
52
Intensive Sites, Multiple Species Data San
Joaquin River at Vernalis
November, 2005
Note mercury scale (0-1000 ng/g) vs. 0-450
ng/g for Prospect Slough
53
Intensive Sites, Multiple Species Data San
Joaquin River at Vernalis
February, 2006
No change during winter, prior to San Joaquin
flooding
54
Intensive Sites, Multiple Species Data San
Joaquin River at Vernalis
July, 2006
In July, following major flooding upstream,
all species up dramatically
55
Intensive Sites, Multiple Species Data San
Joaquin River at Vernalis
September, 2006
By September, quick-changing species down,
indicating reduced exposure other species
declined more slowly
56
Intensive Sites, Multiple Species Data San
Joaquin River at Vernalis
November, 2006
Long-lasting effect in some species bass,
sculpin, red shiner
57
Intensive Sites, Multiple Species Data Cosumnes
River
November, 2005
Note mercury scale (0-2000 ng/g) consistently
high exposure site
58
Intensive Sites, Multiple Species Data Cosumnes
River
February, 2006
No change in February, prior to major flooding
of Cosumnes floodplain
59
Intensive Sites, Multiple Species Data Cosumnes
River
July, 2006
In July, following major flooding upstream,
all species up dramatically
60
Intensive Sites, Multiple Species Data Cosumnes
River
September, 2006
By September, quick-changing species down,
indicating reduced exposure residual elevation
in other species
61
Intensive Sites, Multiple Species Data Cosumnes
River
November, 2006
Residual, significant elevations persisted
long in some species
62
Implications for Watershed Managers
Small fish biosentinels are functioning well as
sensitive indicators of methylmercury exposure.
Different species provide different strengths and
limitations.
Some major wetland areas are apparently not
relative hot spots of MeHg exposure, including
the Napa-Sonoma Marsh and much of the tidal
Delta tule marsh and subtidal SAV zones.
Presence of a Hg loading source tends to increase
exposure.
Watershed flooding can impact large parts of the
system.
Toxicologically-significant changes in exposure
can occur on a seasonal basis, as well as
between years.
Episodic flooding identified as possibly the
single most impor- tant factor leading to
elevated methylmercury exposure for fish.
63
Proposed MeHg Habitat Exposure Factors, Based on
Biosentinel Data
Blue lower exposure Red higher
exposure
Big Break Franks Tract
Napa-S. Marsh (Much of the Bay-Delta)
Petaluma Marsh San Pablo Bay?
Cosumnes Yolo Bypass San Joaquin
Suisun Marsh Yolo Bypass WA Waterfowl/Rice?
Suisun Marsh managed ponds
64
Proposed MeHg Habitat Exposure Factors, Based on
Biosentinel Data (continued)
Blue lower exposure Red higher
exposure
(Vegetation in sub-tidal and daily tidal
wetland habitats apparently not a key source
of relatively elevated exposure)
Petaluma (and San Pablo Bay?) uplands
Yolo Bypass (hist. Hg mining loading source)
65
Prior studies in the Sierras and Coast Ranges
linked exposure strongly to mining sources.
Expectation for the lower watershed was that
wetlands would dominate exposure.
Dominant cases of elevated exposure in 2006 were
all apparently associated with some form of
episodic flooding
Some may be amenable to management
Recommended
