
Satellitebased Flood Detection and Flood Risk Assessment PowerPoint PPT Presentation
1 / 36
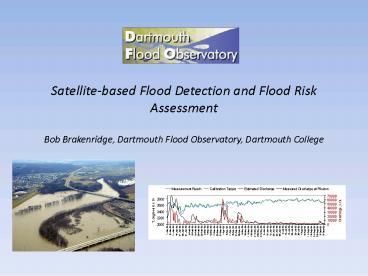
Title: Satellitebased Flood Detection and Flood Risk Assessment
1
Satellite-based Flood Detection and Flood Risk
Assessment Bob Brakenridge, Dartmouth Flood
Observatory, Dartmouth College
2
The Dartmouth Flood Observatory
(http//www.dartmouth.edu/floods/) uses orbital
remote sensing to detect, measure, and map river
flooding, world-wide. It includes Active
Archive of Major Floods (catalogue with
geographic locations, 1985 to present) Rapid
Response Inundation Maps (produced and published
while floods are underway) World Atlas of Flooded
Lands (global digital compilation of all floods
mapped) River Watch (satellite-based flood
measurement and hazard mapping system) .
3
(No Transcript)
4
NASAs two MODIS sensors are the primary flood
mapping tool
- Visible and near IR spectral bands provide
excellent land/water discrimination. - Level 1b automatic georeferencing data accurate
to /- 50 m. - Frequent (more than daily) coverage using both
Aqua and Terra. - Data provided by NASA free via ftp.
- MODIS sensors operating since late 1999 (Terra)
and mid 2002 (Aqua) - Spatial resolution (250 m) is adequate to map
many river floods
5
(No Transcript)
6
Another Example DFO Rapid Response
Inundation Map
7
(No Transcript)
8
(No Transcript)
9
(No Transcript)
10
(No Transcript)
11
(No Transcript)
12
(No Transcript)
13
Typical tile from the digital Atlas of Flooded
Lands
14
(No Transcript)
15
Flood Risk Map for a river in County Cork,
Ireland (Halcrow-Group-Ireland-Ltd, 2007). The
.1, 1, and 10 AEP (annual exceedance
probability) zones are shown in light blue,
medium blue, and dark blue, respectively.
16
(No Transcript)
17
(No Transcript)
18
(No Transcript)
19
(No Transcript)
20
From Gage
To Discharge (via a rating curve)
21
22
16-June-06, M/C .998 27-June-06,
M/C1.065 29-June-06, M/C1.293
23
Objective Monitoring of River Status The
Microwave Solution
The Advanced Microwave Scanning Radiometer -
Earth Observing System (AMSR-E) is a
twelve-channel, six-frequency, passive-microwave
radiometer system. It measures horizontally and
vertically polarized brightness temperatures at
6.9 GHz, 10.7 GHz, 18.7 GHz, 23.8 GHz, 36.5 GHz,
and 89.0 GHz. Spatial resolution of the
individual measurements varies from 5.4 km at 89
GHz to 56 km at 6.9 GHz. AMSR-E was developed by
the Japan Aerospace Exploration Agency (JAXA) and
launched by the U.S. aboard Aqua in mid-2002.
24
Samples of AMSR-E 36.5 GHz images
Eastern Siberia Kolyma River (upper) Lena
River (left middle), Amur River (lower middle).
Central Siberia Jenisei River (middle) Ob
River (lower left)
25
One day of data collection (high latitudes
revisited most frequently)
26
(How does this work?) Many rivers and adjacent
floodplains form landscapes with complex
low-relief topography
When rivers rise, flow width, and water surface
area, increases. Thus more water, less land, in
a given river reach, and more water in any
mixed water/land pixels.
27
Example Wabash River near Mount Carmel, Indiana,
USA
Black square shows Measurement pixel. White
square is calibration pixel.
28
MODIS sequence of 2006 Winter Flooding
2/24/2006 C/M 1.004 3/15/2006 C/M
1.029 3/22/2006 C/M 1.095
29
Site 98, Wabash River at New Harmony, Indiana, USA
30
(No Transcript)
31
(No Transcript)
32
(No Transcript)
33
(No Transcript)
34
Guide to Predicting Inundation Irrawaddy
River, Burma The current hydrologic status and
discharge or C/M ratio can be used to determine
present inundation extent.
2/17/2003 1.18 9/1/2002
1.82 7/24/2004 2.17
35
(No Transcript)
36
http//www.dartmouth.edu/floods/
- River Watch
- Day/Night Flood detection on a near-daily basis
regardless of cloud cover. - Measurement of river discharge changes current
flood magnitude assessments - Immediate map-based prediction of what is under
water - Access to rapid response detailed mapping as new
maps are made - Access to map data base of previous flooding and
associated recurrence intervals.
Recommended
