
What is remote sensing PowerPoint PPT Presentation
1 / 35
Title: What is remote sensing
1
(No Transcript)
2
What is remote sensing?
3
Collection of information about an object without
being in direct contact with the object
4
Medical examples
Cat-scans
X-rays
5
A photograph
6
An aerial photograph
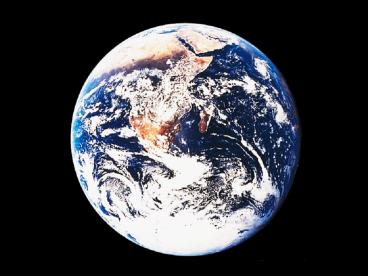
7
A satellite image
Lake Erie
Downtown Cleveland
Cleveland International Airport
8
Highest resolution data available to the public
QuickBird 0.61m pixel
9
Before we could fly
10
How do imaging satellites work?
Satellite sensors see reflected and emitted
radiation
11
Principles of remote sensing
- Energy is detected by a sensor
- All sensors are sensitive to specific areas of
the electromagnetic spectrum - The spectrum consists of electromagnetic
radiation that occurs in various wavelengths - Areas of the electromagnetic spectrum can be
sensed bands - Broad bands
- Narrow bands
12
THE ELECTROMAGNETIC SPECTRUM
13
The spectrum of visible light
- Violet 0.4 - 0.446 mm
- Blue 0.446 - 0.500 mm
- Green 0.500 - 0.578 mm
- Yellow 0.578 - 0.592 mm
- Orange 0.592 - 0.620 mm
- Red 0.620 - 0.7 mm
14
Whats so special about satellite imagery?
15
Satellites
- Satellites are man-made vehicles that orbit the
earth and possess sensors that detect energy that
is emitted from the Earth - Geostationary satellites
- Orbit at 35,784 km above the Earths surface with
an orbit time of 23 hours, 56 minutes, and 4
seconds - Includes TV satellites, communications
satellites, and some weather satellites - Low Earth Orbit (LEO) satellites
- Orbit at lower altitudes typically between 700
km and 3,000 km - Includes GPS satellites, pole to pole orbiting
satellites
16
Geostationary satellites
- Move in-sync with the Earths movements
- TV satellites
- Weather satellites
17
Low Earth Orbit Satellites
- Includes pole to pole orbiting satellites
- Earth spins under the orbiting satellite
- Satellites typically sun-synchronous
- Orbit southward in daylight
- Illuminated zone of Earth
18
Satellites discussed at this institute are all
LEO satellites
- Landsat 30 m 8 bands
- MODIS 1 km 36 bands
- SeaWifs 1.1 km 8 bands
- Topex/Poseidon 50 km satellite altimeter
- AVHRR 1.1 km 5 bands
19
How do satellites collect data?
Along-track scanners
Across-track scanners whiskbroom
20
ExamplePole to pole orbiting satelliteLandsat-7
- 705-km altitude
- 16-day repeat cycle
- 185 km swath width
- Whisk-broom scanner
- Pixel resolution 30m
- 8 bands
21
Spectral curves of Earth materials
Soil
Vegetation
Water
22
Landsat bands 1-4 and spectral curves
1
2
3
4
Soil
Vegetation
Water
23
- Healthy
- Some air cavities in the mesophyll begin to
collapse, results in a drop in IR, no change yet
in visible - Chloroplast deterioration increases red
reflectance. Green reflectance decreases by a
small amount. The overall effect is the
yellowing of the leaf. Reflectance also
decreases in the IR. - Leafs cell structure collapses, red reflectance
increases, the green peak disappears. Leaves
appear brown
24
http//science.nasa.gov/Realtime/jtrack/3d/JTrack3
d.html
25
Some satellite applications
- Global
- Environmental monitoring
- Climate monitoring
- Regional
- Climate and weather
- Vegetation studies
- Urban growth
- Deforestation
- Geology
- Local
- Urban heat islands
- Precision farming
- Land use
- Infrastructure mapping
26
Ocean temperature derived from NOAA-14 AVHRR -
Thermal infrared data
27
Satellite ApplicationsWeather
Cloud temperature
coldest
28
Weather Visible satellite image of Hurricane
Charley, Aug. 13, 2004
29
Doppler radar image of Charley after landfall,
Aug 13th 2004
30
Satellite ApplicationsGeology
Wind River, Wyoming
31
Satellite ApplicationsEnvironmente.g. water
quality
Lake Erie
The Ohio River
Little Blue Run
Downtown Cleveland
32
SeaWifs true color image of Great Lakes
Superior
Huron
Toronto
Michigan
Ontario
Detroit
Erie
Cleveland
Toledo
Pittsburgh
Chicago
33
Chlorophyll A concentration from SeaWifs
34
Satellite ApplicationsPrecision Farming
35
Some websites
- Low resolution
- http//www.goes.noaa.gov/
- Moderate resolution
- http//landsat.gsfc.nasa.gov/
- http//landsat.gsfc.nasa.gov/earthasart/
- http//asterweb.jpl.nasa.gov/gallery/
- High resolution
- http//www.spaceimaging.com
- http//www.digitalglobe.com/
Recommended
