
Middle Pleistocene Transition PowerPoint PPT Presentation
1 / 13
Title: Middle Pleistocene Transition
1
Middle Pleistocene Transition
- James Collins
2
Introduction
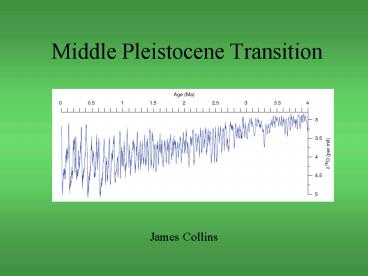
- The Middle Pleistocene Transition (MPT) marks a
change in the response of the climate to orbital
forcing - Benthic d18O record from equatorial Pacific
(Shackleton and Opdyke, 1976) - Pre MPT, climate was dominated by the 41-kyr
cycle. Post MPT, climate dominated by the
100-kyr cycle. - Began at at 1250 ka and was complete by 700 ka
- Earths orbital parameters did not change
Taken from Clarke et al, (2006)
3
Timing of the MPT
- Increase in amplitude across the MPT associated
with glaciations - Mean d18O increases over the MPT some
combination of cooler deep water and more land
ice - Standard deviation increases due to increased
amplitude of the glacial cycles - Filtered stack
- Amplitude of the 100-kyr component increases
across the MPT - Time-frequency spectrogram, shows the
distribution of the low-frequency power
Taken from Clarke et al, (2006)
4
Ice volume vs. Temperature
- How much of the increase amplitude of d18O is due
to ice-volume and how much is due to global deep
water temperature? - Once deep water temperature is accounted for
using Mg/Ca, there is an extra 0.4 increase
post MPT, which equates to an extra ice volume
equivalent to 50m of sea level. - Geological evidence suggests that at the start of
the NHG the area covered by ice was similar to
that after the MPT
Taken from Clarke et al, (2006)
5
SSTs
- North Atlantic SSTs based on foram census counts
decrease through the MPT - Tropical Atlantic SSTs from an alkenone record
minimum at 900 ka - Benguela current alkenone record secular cooling
over the MPT - South Atlantic Modern Analogue Technique
planktonic foram record. Glacial-interglacial
variability began to increase at 870 ka due to
increasing interglacial SSTs.
Taken from Clarke et al, (2006)
6
Monsoons and Aridity
- Percent of eolian sediment. No change over the
MPT - Flux of eolian sediment (African source). Shows
an increase over MPT - Flux of eolian sediment (Arabian source). Shows
an increase over MPT - Chinese loess grain size used to infer monsoon
wind strength. Shows an increase at the MPT. - Biogenic silica percentage in Lake Baikal,
Siberia high biogenic silica indicates warmer
temperatures and an increase in the strength of
the monsoon. Shows an increase at the MPT.
Taken from Clarke et al, (2006)
7
Deep ocean circulation evidence
- d13C values in NADW and CDW records become
depleted at the start of the MPT - Change in ocean circulation
- Erosion of organic soils by growing ice sheets?
- -This would be a continual process and so may
explain the steady decrease - Multi-proxy approach needed to tell us more
Taken from Clarke et al, (2006)
8
900 ka significance
- Signal first appeared at 1250 ka, disappeared for
100 kyr and then re-emerged at 900 ka. - First long (80 kyr) glaciation of Pleistocene at
900 ka - SST minimum
- d13C minimum
- -Could be explained by transfer of organic matter
from shelf deposits - Rapid increase in ice sheet
thickness, sea level fall and exposure of organic
rich shelf sediments
Taken from Clarke et al, (2006)
9
Mechanisms
- Recap mechanism must allow for
- - Increase in ice sheet thickness (same area,
greater volume) - - Decreasing SSTs
- - Increasing aridity
- - 900 ka SST minima
- All mechanisms revolve around the long term
cooling decrease in atmospheric pCO2 - Berger et al (1999)
- Ice sheets never grow large enough during minima
to survive moderate insolation maxima - Under lower pCO2, only deglaciate under maximum
insolation forcing (high eccentricity high
obliquity boreal summer at perihelion) - Rial (2004)
- Colder world allows for greater ice sheet extent
10
Mechanisms
- Tziperman and Gildor (2003) Sea ice switch
hypothesis - Related the MPT to long-term deep water cooling
- Sea ice switch mechanism sea ice is able to
rapidly switch climate from glaciation to
deglaciation - For cold deep-water, rapid sea ice growth has the
effect of starving land ice sheets of moisture - For a warmer deep water, sea ice does not form
until a cooler atmospheric temperature already
in a state of ablation
- Additional support for this hypothesis
- Deep Ocean was cooler (Ruddiman et al 1989)
- IRD rapid deglaciation
11
Mechanisms
- Clark et al (2006) - Regolith Hypothesis
- Ice sheet erosion of a thick regolith to expose
unweathered crystalline bedrock - Low friction regolith allowed development of thin
but laterally extensive ice sheets - High friction nature of unweathered bedrock
allows thicker ice sheets to form - Thicker ice sheets respond differently to orbital
forcing - Possible feedbacks
- An increase in silicate weathering would decrease
pCO2 by 7-12ppm, possibly acting as a feedback - Shield weathering could provide alkalinity for
coral growth during high stands
12
Regolith hypothesis -evidence
- Regolith
- Evidence for a former regolith saprolite in
Minnesota, Canada and the Appalachians - Chemical weathering
- Sediments that have undergone chemical weathering
(ie regolith) will have undergone removal of more
reactive mineral species - Roy (2004b) established that tills younger than
780 ka show major element concentrations most
similar to fresh shield rock. - Sr isotopes
- Regolith soils should have a low 87Sr/86Sr ratio.
Erosion of continents would raise ration of
oceans more than erosion of regolith - eHf
- eHf accelerated at 1200 ka. May reflect enhanced
crushing an partial dissolution of zircons. - Os isotopes
- Reflect continental weathering.
- Os isotopes in weathered soil is depleted
relative to bulk soil. However, dates may be
inaccurate.
Taken from Clarke et al, (2006)
13
Problems with the regolith hypothesis
- Sr may just reflect an overall increase in
weathering - Increase is early would take time to reach the
basement - Hf timing is better
- Why the plateau?
- Os differences in dating give different curves
- Mechanism does not explain the SST peak at 900ka
Recommended
