
EDUC 500: Introduction to Educational Research PowerPoint PPT Presentation
1 / 27
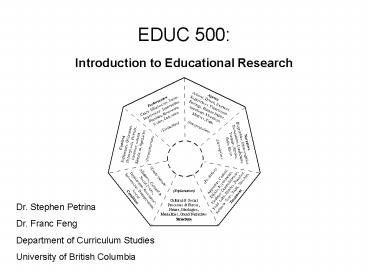
Title: EDUC 500: Introduction to Educational Research
1
EDUC 500 Introduction to Educational Research
Dr. Stephen Petrina Dr. Franc Feng Department of
Curriculum Studies University of British Columbia
2
(No Transcript)
3
EDUC 500
- Methods, procedures, concerns
- Instruments - interview, scale, questionnaire
- research objectives - identifying sample-
reminder quantitative methods keys to questions
(what rather than why) - Population for inclusion in study- people,
events, objects, sampling related to choices of
perspectives, approaches, ethics - Criteria for sampling- related to research
objectives, understanding of phenomena, practical
constraints - Proxies attributes, constructs,
operationalization, rationale for focus
4
EDUC 500
- Diversity Homogeneity vs. heterogeneity,
Invariant/relative blood (Palys, 2003), people
Krech, Crutchfield Ballachey, 1962), classrooms
Denzin Lincoln (1994) - Representativeness, adequateness, intact,
variability, influenced by socialization,
norming, common sense, social construction - Skinner box rat in a maze, operant conditioning-
perhaps facile, consistent with deductive
scientific worldview (invariant example)
5
EDUC 500
- Deductive model - Research in which theory is
driven by a priori underlying assumptions - Functioning to test, explain, affirm (closed)
influences sampling choices, exceptions exist
(e.g. exploratory factor analysis) - Limitations in putting theory before research-
preconceived notions, socialization factors,
where a procedural research decision implicitly
reaffirms and supports a particular social
arrangement (Paly. 2003 127)
6
- Discourses of power (Foucault, 1970, 1972)
- Knowledge as arbitrary, role in surveillance,
control, discursive borders, voice, margins - Knowledge (technical) power
- Influences research from the base directions,
rationale, sampling, etc. - Reasons for sampling based on alternate rationale
that pays attention to the margins
7
EDUC 500
- Why not get statistics of population?
- At times possible- but frequently impossible,
impractical, expensive to sample. - It is possible to make predictions with relative
size samples, around 2000 for national survey
with error limits, where N Population, n
Sample, /- 2)
8
EDUC 500
- Sampling implications -
- Introduce error
- Idea is to minimize this error, with larger
samples, - Declare the margin error we are willing to
tolerate - When we find significance when there is none -
generally set the alpha level at 0.05 (1 in 20),
can set at 0.01 (1 in 100) or if it is really
critical 0.001 (1 in 1000)
9
Sampling
- Sampling language/terminology
- connected with probability theory
- universe, population unit of analysis
- sampling elements
- sampling frame
- Representativeness
- sampling ratio
- sampling error
10
Sampling
- Universe/population
- synonymous terms
- full set of units of analysis/ sampling elements
- not inherent, defined by researcher
- e.g. persons, articles, statements
- an error in unit of analysis can have
implications (Bateson, 1972).
11
Sampling
- Sampling frame
- from population, sampling error
- introduce problems with representativeness
- Probabilistic sampling
- Representativeness
- Descriptions of variability, normality,
linearity, outliers - Implications for ability to generalize back to
population - Larger sample size and random selection helps to
minimize errors in probabilistic sampling
12
Probability-Based Sampling
- Probability-Based Sampling
- within margin of error- with random sampling
- all elements have equal probability of being
selected - every element is listed once and once only
- minimizes sampling error, deviation from
population mean
13
Sampling errors
- Two main errors we need to be concerned with
- 1) Systematic errors - the introduction of
systematic bias - 2) Random errors- due to vagaries of chance
variation (range of certainty, e.g. 47 to 53),
larger sample size, better estimate of real
figure - See table how as sample size increases
- lower sampling error, as size of confidence
interval decreases (Palys, 2003 131, 132) - Yet, note counter- example of Bush speech with
CBS twin polls touchtone phone in vs.
commissioned survey (p.138-139)
14
Tyranny of the majority
- Tyranny of the majority (Palys, 132)
- two languages/meanings of representation
- dominant group vs. under-represented minority
groups - one way to ensure rights of the minority groups
are represented- research sub-groups - If as researchers, we are concerned with issues
of marginalization, minority interests/disparaged
social groups, then probabilistic sampling might
not be an issue. - If we are less concerned with need to mirror the
population in which representation is
disproportionate, as we shall see, there are
non-probabilistic sampling/qualitative approaches
15
Other approaches
- Other approaches to sampling-
- systematic sample with random start- cyclical
- will need to recognize problems with periodicity
(e.g hockey teams, apartments - stratified random sampling (note error in text,
35 not 10) - when probabilities are known ahead of time
- stratifying according to variable of interest to
make comparisons - need large sample sizes for proportional
stratified random sampling - can use different sampling ratios in
disproportionate stratified random sampling but
then, can no longer generalize, only compare
16
In absence of sampling frame
- When sampling frame is not readily available
- could employ multistage cluster sampling
- performing random sampling of clusters within
each successive cluster, until the desired
representativeness criterion is reached (Plays,
2003 136) - should be used only when sampling frame is
unavailable since errors accumulates - also with content analysis for other objects of
interest
17
Non-Probabilistic Sampling
- Haphazard, convenience or accidental sampling
- minimal requirements, ideally, somewhat
homogenous - with respect to phenomenon of interest (Palys,
2003 142) - Pilot research to pretest research instruments
- Research aimed at generating universals
18
Non-Probabilistic Sampling
- Purposive sampling
- Does not aim for formal representativeness
- Intentionally sought for criteria
- Reflects researchers interest and understanding
of phenomenon of interest - When sampling individuals could be more
inductive, exploratory - Field-based research choice of informants-
including naïve, frustrated, outsider, rookie,
outs, old hand (Dean et al., 1969) - Informants vary in willingness to disclose
19
Non-Probabilistic Sampling
- Purposive sampling (continued)
- Extreme or deviant case sampling - for instance,
experience of pain (Morse, 1994) - Intensity sampling - experienced experts,
frequent or ongoing exposure to phenomenon of
interest) - Maximum variety sampling (emphasizes sampling for
diversity) - Snowball sampling - using connections useful for
deviant populations (Salamon, 1984), first
influences - Quota sampling (target population with known
characteristics)- Gallup -heterogeneous without
true representativeness
20
Eliminating rival hypothesis
- Towards relational research relationships,
explanations - Experimentalist
- Classic experiment
- Quasi-experimentation
- Case-Study analysis
- Share common logic- control over rival plausible
explanations - Make reasonable inferences about causes
- Approaches vary in degree emphasize
- Manipulative or analytical control
21
Towards experimental design
- Science three types of questions, according to
Lofland (1971) - Characteristics
- Causes
- Consequences
- Expand to include considerations of antecedents
(causes) of phenomena of interest - Implications (consequences) for other variables
of interest - Focus turns to examining relationships among
variables and explaining how variables interact
to produce phenomena of interest - Informed by literature, allows for theorizing by
examining relationships
22
The Problem of Causality
- Causal relationships, causality
- Differ slightly from Palys treatment of
causality - Non-trivial to claim causation
- Although Palys adds, we cannot say that the
experiment proved Pascals theory. - Why? Why not? What can we say at best?
- Role of theory in contributing to explanation
23
Cook and Campbell (1979) - Torricellian vacuum,
Pascals experiment
- Pascals historical experiment, elements of
experimental design - Independent variable - effect to assess,
manipulable - Dependent variable - measure of effect of
independent variable - Comparison to test for treatment effect
- Design compare two tubes exposed to identical
conditions except for treatment (change in
altitude) - Support, consistent, although cannot say proved
competing theories, jury never quite out - Towards terminology and logic of experimentation
24
Pretest/Posttest Design Example from the text
X
O2
O1
(Pretest)
(Treatment)
(Postest)
- Research question Does watching a series of
films about immigrants contributions to Canadian
culture affect peoples attitude toward
immigration policies and current immigration
levels. (p. 260) - Procedure, approach and design (what are these?)
- Who are the participants/subjects/informants/respo
ndents? - Why have we selected these participants?
- Know initial conditions- preliminary measure of
attribute - Reliable and valid instrument to measure
attribute under study - Application of treatment
- Measure and assessing impact of treatment, if any
- Number of variables exposure to film
(manipulated), measure to see whether change has
occurred - Independent variable as treatment variable
25
Internal Validity Research Design
- If there is change, can we attribute it to our
independent variable? - How confident are we that the change was due to
the variable that we manipulated? - Enter internal validity the extent to which
differences observed in the study can be
unambiguously attributed to the experimental
treatment itself, rather than other factors
(Campbell Stanley, 1963) - they wrote the
book - Key question to what extent, can we be
confident that the differences we observed are
caused by the independent variable per se, rather
than by rival plausible explanations? (Palys,
261). - We need to consider possible threats to
internal validity (Campbell Stanley, 1963).
What are some of these? - No matter how we try to minimize the possibility,
random errors will occur
26
Typical threats to Internal Validity that offer
rival explanations for change
- Key question Can we be sure that the effect we
observed was caused by the independent variable
in our design? Uncertainty rears its head why?
For a host of reasons some of these include - History - pretest/posttest design, in the process
- Maturation- biological effects, with participants
changing as a function of time - Testing- sensitization to the test- even
administration can be factor, pretest
sensitization, practice effects - Statistical regression towards the mean- more
apparent than real- tendency for extreme scorers
on the first testing to score closer to mean
(average) on the second or subsequent testing
and the more extreme the first score, the
greater the tendency (Palys, p. 263).
27
References
- Images used in this presentation were sourced
from the following URLs - People on the move http//www.freefoto.com/previ
ew.jsp?id04-26-13kPeopleonthemove - Starhawk http//www.gayblock.com/wsltwo.html
- Martin Luther King http//www.kycourts.net/AOC/Mi
norityAffairs/Martin Luther King, Jr. -- 3.jpg - Donna Haraway http//www.egs.edu/images/faculty/d
onna-haraway-2-03.jpg - Vandana Shiva http//www.workingtv.com/images25/v
andana300.jpg - Michel Foucault http//www.iranao.com/newsimages/
Foucault.2.jpg - Normal curve (animated) http//research.med.umkc.
edu/tlwbiostats/sem03.html - Normal curve http//upload.wikimedia.org/wikipedi
a/en/thumb/b/bb/Normal_distribution_and_scales.gif
/500px-Normal_distribution_and_scales.gif
Recommended
