
Discrimination between normal and cancerous cells by gapFRAP : Feasability in endoscopy - PowerPoint PPT Presentation
1 / 1
Title:
Discrimination between normal and cancerous cells by gapFRAP : Feasability in endoscopy
Description:
... laser scanning microscope (SP2-AOBS Leica Microsystems), is equipped of a ... (LEICA DMIRE2 HC Fluo TCS 1-B), of an argon laser source at 488 nm and an ... – PowerPoint PPT presentation
Number of Views:33
Avg rating:3.0/5.0
Title: Discrimination between normal and cancerous cells by gapFRAP : Feasability in endoscopy
1
Discrimination between normal and cancerous cells
by gap-FRAP Feasability in endoscopy
Centre de Recherche en Automatique de Nancy - UMR
7039
Centre Alexis Vautrin
Jean-René Stines1, Dominique Dumas2, Walter
Blondel 3, Jacques Didelon1 et François
Guillemin1 1 CAV-CRAN - Centre Alexis Vautrin
54511 Vandoeuvre (France), téléphone 03 83 59
85 81, Fax 03 83 44 60 71, jr.stines_at_nancy.fnclcc
.fr, j.didelon_at_nancy.fnclcc.fr,
f.guillemin_at_nancy.fnclcc.fr 2 LEMTA - Laboratoire
de mécanique et ingénierie cellulaire et
tissulaire Faculté de médecine, 54511 Vandoeuvre
(France), Téléphone 03 83 68 34 65
dumas_at_hemato.u-nancy.fr 3 CRAN CNRS UMR
7039, Institut National Polytechnique de
Lorraine, 54511 Vandoeuvre (France), Téléphone
03 83 59 56 38, Fax 03 83 59 56 30,
walter.blondel_at_ensem.inpl-nancy.fr
INTRODUCTION New cancer diagnosis possibilities
are actually explored through photo-diagnostic
approaches consisting in tissue analysis by
optical biopsy. In the case of tumor cells,
recent data have shown a decrease in the number
of gap junctions which can also be associated
with a reduced functionality In this work, we
are focused on the discrimination between healthy
and tumoral cells, by studying the efficiency of
gap-junctions in the diffusion of the molecules
targeted during the fluorescence recovery (FRAP).
MATERIALS AND METHODS Three cells lines HT-29
types (human colon adenocarcinoma), MCF-7 (human
breast cancer) and CCD-1137Sk (human skin
fibroblasts) were stained with 5.6CFDA (6µg/ml
Molecular Probes Inc, Oregon, USA) during 15 min
at 37C and washed 3 times with the RPMI (without
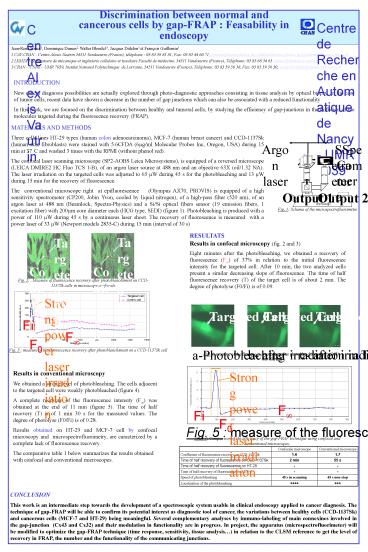
phenol red). The confocal laser scanning
microscope (SP2-AOBS Leica Microsystems), is
equipped of a reversed microscope (LEICA DMIRE2
HC Fluo TCS 1-B), of an argon laser source at 488
nm and an objective 63X (oil/1.32 NA). The laser
irradiation on the targeted cells was adjusted to
65 µW during 45 s for the photobleaching and 13
µW during 15 min for the recovery of
fluorescence. The conventional microscope right
at epifluorescence (Olympus AX70, PROVIS) is
equipped of a high sensitivity spectrometer
(CP200, Jobin Yvon, cooled by liquid nitrogen),
of a high-pass filter (520 nm), of an argon laser
at 488 nm (Beamlock, Spectra-Physics) and a Si/Si
optical fibers sensor (19 emission fibers, 1
excitation fiber) with 200µm core diameter each
(HCG type, SEDI) (figure 1). Photobleaching is
produced with a power of 110 µW during 45 s by a
continuous laser shoot. The recovery of
fluorescence is measured with a power laser of
33 µW (Newport models 2835-C) during 15 min
(interval of 30 s)
- SSpectrometer
Fig. 1 Schema of the microspectrofluorimètre
RESULTATS Results in confocal microscopy (fig. 2
and 3)T15min Eight minutes after the
photobleaching, we obtained a recovery of
fluorescence (F?) of 37 in relation to the
initial fluorescence intensity for the targeted
cell. After 10 min, the two analyzed cells
present a similar decreasing slope of
fluorescence. The time of half fluorescence
recovery (T) of the target cell is of about 2
min. The degree of photolyse (F0/Fi) is of 0.09.
Targeted Cell
Targeted Cell
Control Cell
Control Cell
Fig. 2 . Measure of fluorescence recovery after
photoblanchiment on CCD-1137Sk cells in
microscopy confocale
Fig. 3 measure of the fluorescence recovery
after photoblanchiment on a CCD-1137Sk cell
Results in conventional microscopy We obtained a
strong level of photobleaching. The cells
adjacent to the targeted cell were weakly
photobleached (figure 4). A complete recovery of
the fluorescence intensity (F?) was obtained at
the end of 11 min (figure 5). The time of half
recovery (T) is of 1 min 30 s for the measured
values. The degree of photolyse (F0/Fi) is of
0.28. Results obtained on HT-29 and MCF-7 cell
by confocal microscopy and microspectrofluorimetr
y, are caracterized by a complete lack of
fluorescence recovery. The comparative table 1
below summarizes the results obtained with
confocal and conventional microscopes.
Table 1 Comparison of the efficiency of the
gap-FRAP technique using confocal and
conventional microscopes.
CONCLUSION This work is an intermediate step
towards the development of a spectroscopic system
usable in clinical endoscopy applied to cancer
diagnosis. The technique of gap-FRAP will be able
to confirm its potential interest as diagnostic
tool of cancer, the variations between healthy
cells (CCD-1137Sk) and cancerous cells (MCF-7 and
HT-29) being meaningful. Several complementary
analyses by immuno-labeling of main connexines
involved in the gap-junction (Cx43 and Cx32) and
their modulation in functionality are in
progress. In project, the apparatus
(microspectrofluorimeter) will be modified to
optimize the gap-FRAP technique (time response,
sensitivity, tissue analysis) in relation to the
CLSM reference to get the level of recovery in
FRAP, the number and the functionality of the
communicating junctions.