
FIGURE 1 PowerPoint PPT Presentation
1 / 1
Title: FIGURE 1
1
Candidate Pool Profile of Faculty Searches in
31 Science and
Engineering Departments at
Case Western Reserve University, AY 2001-02 to
AY 2005-06
Background
- Candidate pool diversity is a goal of both the
University and the ACES-ADVANCE program - A study was undertaken with IRB approval to
examine the diversity of candidate pools for
faculty searches occurring in the 31 NSF-funded
SE departments at the University from 2001-02 to
the present - Paper files in the Universitys Office of Equal
Opportunity and Diversity were reviewed by
ACES-ADVANCE research staff - Most recent data is from AY 2005-06 Review of AY
2006-07 searches is underway - To date, 145 faculty searches identified and
entered into a SPSS database - Variables collected
- Year of Search, School at the University, and
Department undergoing the search - Number of candidates in each search, with
stratification by gender and race - Number of short list candidates in each search,
stratified by gender and race - Gender, Race, Rank, Tenure Status, and Decision
of faculty hire. - In short, 145 faculty searches were conducted
with 7366 total applicants, yielding offers to 49
females and 96 males - The following figures illustrate temporal and
school-level trends in candidate pool
composition, as well as tenure status of new
hires and acceptance of offer by gender
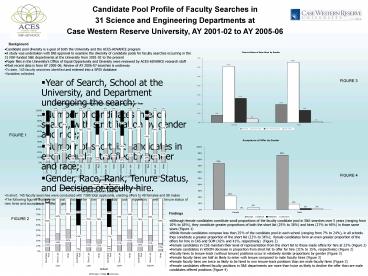
FIGURE 3
FIGURE 1
FIGURE 4
Findings
- Although female candidates constitute small
proportions of the faculty candidate pool in SE
searches over 5 years (ranging from 10 to 18),
they constitute greater proportions of both the
short list (25 to 36) and hires (27 to 46) in
those same years (Figure 1) - While female candidates compose less than 25 of
the candidate pool in each school (ranging from
7 to 24), in all schools they constitute a
greater proportion of the short list (22 to
34) female candidates form an even greater
proportion of the offers for hire in CAS and SOM
(42 and 41, respectively) (Figure 2) - Female candidates in CSE maintain their level of
representation from the short list to those made
offers for hire at 22 (Figure 2) - Female candidates in WSOM decrease in proportion
from short list to offer for hire (31 to 15,
respectively) (Figure 2) - Faculty hires to tenure-track (without tenure)
positions occur in relatively similar proportions
by gender (Figure 3) - Female faculty hires are half as likely to enter
with tenure compared to male faculty hires
(Figure 3) - Female faculty hires are twice as likely to be
hired to non tenure-track positions than are male
faculty hires (Figure 3) - Female candidates offered faculty positions in
SE departments are more than twice as likely to
decline the offer than are male candidates
offered positions (Figure 4)
FIGURE 2
Recommended
