
Grid for Ocean Diagnostics, Interactive Visualisation and Analysis GODIVA - PowerPoint PPT Presentation
1 / 10
Title: Grid for Ocean Diagnostics, Interactive Visualisation and Analysis GODIVA
1
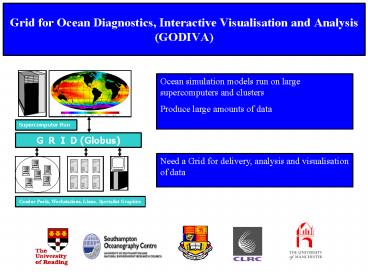
Grid for Ocean Diagnostics, Interactive
Visualisation and Analysis (GODIVA)
2
Basic capabilities
3
Web Services
- Powerful way to implement distributed computing
modular, loosely-coupled - Platform neutral
- Message passing in machine-independent form
- Existing code can be easily converted to WS form
- Client can be desktop, handheld PC, mobile phone,
another Web Service, etc - Future Grid Services
- Extend WS to add features to help Grid computing
4
Web and Grid servicesfor large model data sets
- (Data discovery) NERC DataGrid
- Distributed Data Management Layer (GADS)
- Data Delivery Service (http, ftp, gridftp,
security) - Visualisation Services (Server side, distributed,
client side) - Data Transformation services (interpolation,
re-mapping) - Diagnostics and intercomparison services (Grid
Services)
5
Grid Access Data Service (GADS)
dataQuery()
Data (GRIB, NetCDF, HDF)
6
Data sets currently served
- Met Office real time ocean forecasts at 1, 1/9
resolution - ECMWF surface Met conditions (10 day forecasts)
- High Resolution ocean model data (1/12 OCCAM)
- Some satellite data e.g. TRMM (provided by SOC)
7
Bringing Web Services together
a.k.a. Orchestration
Perform diagnostics
Compare datasets
Visualise results
Convert format
8
GODIVA Data Portal
(movie)
9
The Future
- Reading e-Science Centre (ReSC)
- Promote Web and Grid Service technology across
environmental science community Open Source - Academic community (Data Assimilation Research
Centre) - Met Office, Environment Agency
- ECMWF and EU Framework e.g. MERSEA
- Commercial sector (SEEDA project, BMT and
Maritime Coastguard Agency for Oil spill, Search
and Rescue) - Further collaborations and inter-operability with
other environmental science Grids
10
Conclusions
- Developing techniques and tools for working with
very large data sets - Of general use, not just for oceanographers
- Web Services are very important
- Enables collaboration across institutions and
national borders - Applications to both public and commercial sectors
Recommended
CrystalGraphics Presentations


