
AAAS PowerPoint PPT Presentation
Title: AAAS
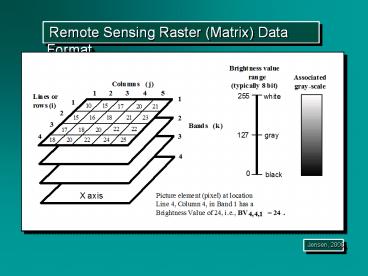
1
Remote Sensing Raster (Matrix) Data Format
Jensen, 2000
2
Types of Detector Configurations Used for
Multispectral and Hyperspectral Remote Sensing
Jensen, 2000
3
Chronological Launch and Retirement History of
the Landsat Satellite Series
Jensen, 2000
4
Landsat Multispectral Scanning System (MSS)
Jensen, 2000
5
Inclination of the Landsat Orbit to Maintain A
Sun-synchronous Orbit
N
S
Jensen, 2000
6
Landsat Multispectral Scanning System (MSS) Orbit
Jensen, 2000
7
Orbit Tracks of Landsat 1, 2, or 3 During A
Single Day of Coverage
Jensen, 2000
8
Landsat 4 and 5 Worldwide Reference System
Jensen, 2000
9
Components of the Landsat Multispectral Scanner
(MSS) System on Landsat 1 Through 5
Jensen, 2000
10
Landsat MSS Bandwidths
Jensen, 2000
11
Terrestrial Images of Goleta, CA Obtained on
March 4, 1972 Using the Landsat MSS
Band 4 (0.5 - 0.6 mm)
Band 5 (0.7 - 0.8 mm)
Jensen, 2000
12
Components of the Landsat 4 and 5 Thematic Mapper
Jensen, 2000
13
Spectral and Spatial Resolution of the Landsat
Multispectral Scanner (MSS), Landsat 4 and 5
Thematic Mapper (TM), Landsat 7 Enhanced Thematic
Mapper Plus (ETM), SPOT 1, 2, and 3 High
Resolution Visible (HRV), and SPOT 4 High
Resolution Visible Infrared (HRVIR) Sensor Systems
Jensen, 2000
14
Seven Bands of Landsat Thematic Mapper Data of
Charleston, SC, Obtained on February 3, 1994
Jensen, 2000
15
Landsat 7 Enhanced Thematic Mapper Plus
Jensen, 2000
16
Landsat 7 Image of Palm Spring, CA 30 x 30 m
(bands 4,3,2 RGB)
Jensen, 2000
17
Landsat 7 Image of Palm Spring, CA 30 x 30 m
(bands 7,4,2 RGB)
Jensen, 2000
18
First Landsat 7 ETM Image Obtained over Sioux
Falls, SD on April 18, 1999
Jensen, 2000
19
GOES East and West Coverage
20
GOES Imager Optical Elements
Jensen, 2000
21
GOES East and West Coverage
GOES East Infrared August 25, 1989
GOES East Visible August 25, 1989
Jensen, 2000
22
GOES East Infrared
GOES East Visible
GOES East August 25, 1989
GOES East Water Vapor
Jensen, 2000
23
Advanced Very High Resolution Radiometer (AVHRR)
Data Acquisition Characteristics
Jensen, 2000
24
Advanced Very High Resolution Radiometer (AVHRR)
Bandwidths
Jensen, 2000
25
Advanced Very High Resolution Radiometer (AVHRR)
Imagery
Jensen, 2000
26
Advanced Very High Resolution Radiometer (AVHRR)
Mosaic of the Conterminous United States
Jensen, 2000
27
Global Normalized Difference Vegetation Index
(NDVI) Image Produced Using Advanced Very High
Resolution Radiometer (AVHRR) Imagery
Jensen, 2000
28
Characteristics of the Daedalus Airborne
Multispectral Scanner (AMS)
Jensen, 2000
29
Near-infrared Band 6 (0.76 - 0.90 mm) Airborne
Terrestrial Applications Sensor (ATLAS) Image of
Sullivans Island, SC Obtained October 15, 1998
Jensen, 2000
30
Pre-dawn Thermal Infrared Imagery of the Four
Mile Creek Plume in the Savannah River near
Augusta, Georgia
Jensen, 2000
31
Chronological Launch History of the SPOT
Satellites
Jensen, 2000
32
SPOT Satellite System Components
Courtesy of SPOT Image, Inc.
Jensen, 2000
33
Scanning Electron Microscope Image of the Front
Surface of a CCD Linear Array Like that Used in
the SPOT HRV Sensor Systems
100 mm
Courtesy of SPOT Image, Inc.
10 mm
Jensen, 2000
34
SPOT NADIR View
60 km swath width 3 km overlap 117 km total width
Jensen, 2000
35
SPOT Off -NADIR View
Jensen, 2000
36
SPOT Off -NADIR Revisit Capabilities
Jensen, 2000
37
SPOT Stereoscopic Viewing Capabilities
Jensen, 2000
38
Comparison of the Detail of 30 x 30 m Landsat TM
Band 3 Data and SPOT 10 x 10 m Panchromatic Data
of Charleston, SC
Courtesy of SPOT Image, Inc.
Jensen, 2000
39
Geographic Coverage of the SPOT HRV and Landsat
Thematic Mapper Remote Sensing Systems
Jensen, 2000
40
Portion of the First Global 10-day Synthesis
Image Produced Using the SPOT Vegetation Sensor
May 11-20, 1998
Courtesy of SPOT Image, Inc.
Jensen, 2000
41
Indian Remote Sensing Satellite (IRS-1D)
Panchromatic Image of Downtown San Diego, CA at 5
x 5 m
Jensen, 2000
42
Multi-angle Imaging Spectroradiometer (MISR)
Onboard Terra
Jensen, 2000
43
IKONOS Panchromatic Images of Washington, DC
Jensen, 2000
1 x 1 m spatial resolution
44
IKONOS Panchromatic Stereopair of Columbia, SC
Airport
November 15, 2000
Jensen, 2000
45
IKONOS Imagery of Columbia, SC Obtained on
October 28, 2000
Panchromatic 1 x 1 m
Pan-sharpened multispectral 4 x 4 m
46
Imaging Spectrometry
Jensen, 2000
47
Reflectance of the Upper Surface of A Sycamore
Leaf at Different Moisture Contents
Jensen, 2000
48
NASA AVIRIS Advanced Visible Infrared Imaging
Spectrometer
Jensen, 2000
49
Airborne Visible Infrared Imaging Spectrometer
(AVIRIS) Datacube of Sullivans Island Obtained
on October 26, 1998
Jensen, 2000
50
Hyperspectral Crop Classification Using AVIRIS
Data
Jensen, 2000
51
Area Array Pushbroom Imaging Spectrometer Concept
512 pixels
512 pixels
Jensen, 2000
52
Positive Systems, Inc., Imagery
Green
Red
Near-Infrared
System Components
Jensen, 2000
53
Emerge Spatial, Inc., Imagery
Green
Red
Near-Infrared
Jensen, 2000
54
Litton Emerge Spatial, Inc., CIR image (RGB
NIR,R,G) of Dunkirk, NY, at 1 x 1 m obtained on
December 12, 1998
Natural color image (RGB RGB) of a N.Y. Power
Authority lake at 1 x 1 ft obtained on October
13, 1997
Jensen, 2000
55
Digital Frame Camera Imagery of Harbour Town,
Hilton Head, SC
1 x 1 ft spatial resolution
56
Earth Observing System Measurements
Discipline
EOS-AM Instruments
Measurement
Atmosphere Cloud Properties
MODIS, MISR, ASTER Radiative Energy
Fluxes CERES, MODIS, MISR Precipitation Tropo
spheric Chemistry MOPITT Stratospheric
Chemistry Aerosol Properties MISR,
MODIS Atmospheric Temperature MODIS Atmospher
ic Humidity MODIS Lightning
Jensen, 2000
57
Earth Observing System Measurements
Discipline
EOS-AM Instruments
Measurement
Land Land Cover/Land Use Change MODIS, MISR,
ASTER Vegetation Dynamics MODIS, MISR,
ASTER Surface Temperature MODIS, ASTER Fire
Occurrence MODIS, ASTER Volcanic
Effects MODIS, MISR, ASTER Surface Wetness
Jensen, 2000
58
Earth Observing System Measurements
Discipline
EOS-AM Instruments
Measurement
Ocean Surface Temperature MODIS Phytoplankton
MODIS, MISR Dissolved Organic Matter MODIS,
MISR Surface Wind Fields Ocean Surface
Topography
Cryosphere Land Ice Change ASTER Sea Ice
MODIS, ASTER Snow Cover MODIS, ASTER
Solar Radiation Total Solar Radiation Ultrav
iolet Spectral Irradiance
59
Earth Observing System - Terra Instruments
MODIS - Moderate-resolution Imaging
Spectroradiometer Spectral Range 0.4 -
14.4 mm Spectral Coverage 55, 2330 km
swath Spatial Resolution 250 m (2 bands),
500 m (5 bands), 1000 m (29 bands)
ASTER - Advanced Spaceborne Thermal Emission and
Reflection Radiometer Spectral Range VNIR
0.4 - 14.4 mm, SWIR 1.6 - 2.5 mm, TIR 8 - 12
mm Spatial Resolution 15 m (VNIR 3
bands) 30 m (SWIR 6 bands) 90
m (TIR 5 bands)
Jensen, 2000
Recommended
