
Keogh, Chakrabarti, Pazzani PowerPoint PPT Presentation
Title: Keogh, Chakrabarti, Pazzani
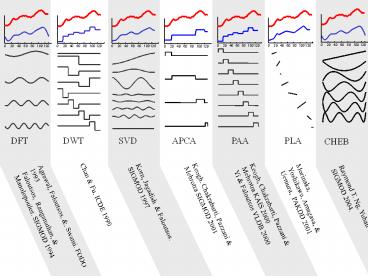
1
CHEB
Raymond T. Ng, Yuhan Cai SIGMOD 2004.
Morinaka, Yoshikawa, Amagasa, Uemura, PAKDD
2001
Korn, Jagadish Faloutsos. SIGMOD 1997
Chan Fu. ICDE 1999
Agrawal, Faloutsos, . Swami. FODO
1993 Faloutsos, Ranganathan, Manolopoulos.
SIGMOD 1994
Keogh, Chakrabarti, Pazzani Mehrotra KAIS
2000 Yi Faloutsos VLDB 2000
Keogh, Chakrabarti, Pazzani Mehrotra SIGMOD
2001
2
A Different Approach
- All the previous representations have been real
valued, but think of what you can do with
discrete data that you cannot do (or do easily)
with real valued data - Markov Models, Suffix Trees, Hashing, Relevance
Feedback, Kolmogorov Complexity etc - There are many symbolic representations in the
literature, but none lower bound, and they are
typically ad hoc, high dimensionally and
generally not useful for data mining.
3
There is now a symbolic representation of time
series that allows
- Lower bounding of Euclidean distance
- Dimensionality Reduction
- Numerosity Reduction
4
We call our representation SAXSymbolic Aggregate
ApproXimation
baabccbc
5
How do we obtain SAX?
C
C
0
20
40
60
80
100
120
First convert the time series to PAA
representation, then convert the PAA to
symbols It takes linear time
baabccbc
6
Visual Comparison
- A raw time series of length 128 is transformed
into the word ffffffeeeddcbaabceedcbaaaaacddee. - We can use more symbols to represent the time
series since each symbol requires fewer bits than
real-numbers (float, double)
7
SAX is Good!
- For classification, clustering and indexing of
time series, SAX is as good or better than - Fourier Transforms
- Wavelets
- The raw data!
- But I am not going to show you this today!
- (See Jessica Lins DMKD 2003 paper)
8
SAX is Great!
- SAX lets us do things that are difficult or
impossible with other representations. - Finding motifs in time series (ICDM 02, SIGKDD
03) - Visualizing massive time series (SIGKDD04, VLDB
04) - Cluster from streams (ICDM 03, KAIS 04)
- Kolmogorov complexity data mining (SIGKDD 04)
- The papers above are just from my group, there
are now a few dozen groups around the world using
SAX.
9
The Joy of SAXSAX Ideas
Idea I A lite-weight, but incredibly useful
tool call time series bitmaps. To explain
time series bitmaps, we begin with a digression
into DNA
10
TGGCCGTGCTAGGCCCCACCCCTACCTTGCAGTCCCCGCAAGCTCATCTG
CGCGAACCAGAACGCCCACCACCCTTGGGTTGAAATTAAGGAGGCGGTTG
GCAGCTTCCCAGGCGCACGTACCTGCGAATAAATAACTGTCCGCACAAGG
AGCCCGACGATAGTCGACCCTCTCTAGTCACGACCTACACACAGAACCTG
TGCTAGACGCCATGAGATAAGCTAACACAAAAACATTTCCCACTACTGCT
GCCCGCGGGCTACCGGCCACCCCTGGCTCAGCCTGGCGAAGCCGCCCTTC
A
The DNA of two species
CCGTGCTAGGGCCACCTACCTTGGTCCGCCGCAAGCTCATCTGCGCGAAC
CAGAACGCCACCACCTTGGGTTGAAATTAAGGAGGCGGTTGGCAGCTTCC
AGGCGCACGTACCTGCGAATAAATAACTGTCCGCACAAGGAGCCGACGAT
AAAGAAGAGAGTCGACCTCTCTAGTCACGACCTACACACAGAACCTGTGC
TAGACGCCATGAGATAAGCTAACA
11
C
T
C
T
C
T
C
T
C
T
A
G
A
G
A
G
A
G
A
G
0.20
0.24
CCGTGCTAGGGCCACCTACCTTGGTCCGCCGCAAGCTCATCTGCGCGAAC
CAGAACGCCACCACCTTGGGTTGAAATTAAGGAGGCGGTTGGCAGCTTCC
AGGCGCACGTACCTGCGAATAAATAACTGTCCGCACAAGGAGCCGACGAT
AAAGAAGAGAGTCGACCTCTCTAGTCACGACCTACACACAGAACCTGTGC
TAGACGCCATGAGATAAGCTAACA
0.26
0.30
12
CC
CCC
CCT
CTC
CCC
CCT
CTC
CCC
CCT
CTC
CCC
CCT
CTC
CC
CT
TC
TT
CC
CT
TC
TT
CC
CT
TC
TT
CC
CT
TC
TT
CC
CT
TC
TT
CC
CT
TC
TT
CC
CT
TC
TT
CT
TC
TT
C
T
C
T
C
T
C
T
C
T
C
T
CCA
CCG
CTA
CCA
CCG
CTA
CCA
CCG
CTA
CCA
CCG
CTA
CAC
CAT
CAC
CAT
CAC
CAT
CAC
CAT
CA
CG
TA
TC
CA
CG
TA
TG
CA
CG
TA
TC
CA
CG
TA
TC
CA
CG
TA
TC
CA
CG
TA
TC
CA
CG
TA
TC
CA
CG
TA
TG
CAA
CAA
CAA
CAA
AC
AT
GC
GT
AC
AT
GC
GT
AC
AT
GC
GT
AC
AT
GC
GT
AC
AT
GC
GT
AC
AT
GC
GT
AC
AT
GC
GT
AC
AT
GC
GT
A
G
A
G
A
G
A
G
A
G
A
G
AA
AG
GA
GG
AA
AG
GA
GG
AA
AG
GA
GG
AA
AG
GA
GG
AA
AG
GA
GG
AA
AG
GA
GG
AA
AG
GA
GG
AA
AG
GA
GG
CCGTGCTAGGGCCACCTACCTTGGTCCGCCGCAAGCTCATCTGCGCGAAC
CAGAACGCCACCACCTTGGGTTGAAATTAAGGAGGCGGTTGGCAGCTTCC
AGGCGCACGTACCTGCGAATAAATAACTGTCCGCACAAGGAGCCGACGAT
AAAGAAGAGAGTCGACCTCTCTAGTCACGACCTACACACAGAACCTGTGC
TAGACGCCATGAGATAAGCTAACA
13
0.04
0.02
0.04
0.09
1
0.02
0.03
0.07
CA
CA
CA
CA
CA
CA
CA
CA
CA
CA
0.03
0.11
AC
AT
AC
AT
AC
AT
AC
AT
AC
AT
AC
AT
AC
AT
AC
AT
AC
AT
AC
AT
AA
AG
AA
AG
AA
AG
AA
AG
AA
AG
AA
AG
AA
AG
AA
AG
AA
AG
AA
AG
CCGTGCTAGGCCCCACCCCTACCTTGCAGTCCCCGCAAGCTCATCTGCGC
GAACCAGAACGCCCACCACCCTTGGGTTGAAATTAAGGAGGCGGTTGGCA
GCTTCCCAGGCGCACGTACCTGCGAATAAATAACTGTCCGCACAAGGAGC
CCGACGATAGTCGACCCTCTCTAGTCACGACCTACACACAGAACCTGTGC
TAGACGCCATGAGATAAGCTAACA
0
14
OK. Given any DNA string I can make a colored
bitmap, so what?
CCGTGCTAGGCCCCACCCCTACCTTGCAGTCCCCGCAAGCTCATCTGCGC
GAACCAGAACGCCCACCACCCTTGGGTTGAAATTAAGGAGGCGGTTGGCA
GCTTCCCAGGCGCACGTACCTGCGAATAAATAACTGTCCGCACAAGGAGC
CCGACGATAGTCGACCCTCTCTAGTCACGACCTACACACAGAACCTGTGC
TAGACGCCATGAGATAAGCTAACA
15
(No Transcript)
16
- Two Questions
- Can we do something similar for time series?
- Would it be useful?
17
Can we do make bitmaps for time series?
Yes, with SAX!
accbabcdbcabdbcadbacbdbdcadbaacb
Time Series Bitmap
18
While they are all example of EEGs, example_a.dat
is from a normal trace, whereas the others
contain examples of spike-wave discharges.
19
We can further enhance the time series bitmaps by
arranging the thumbnails by cluster, instead of
arranging by date, size, name etc We can achieve
this with MDS.
20
ventricular depolarization
plateau stage
repolarization
recovery phase
initial rapid
initial rapid
repolarization
repolarization
0
100
200
300
400
500
0
100
200
300
400
500
Some of the data are not heartbeats! They are the
action potential of a normal pacemaker cell
0
100
200
300
400
500
21
We can test how much useful information is
retained in the bitmaps by using only the bitmaps
for clustering/classification/anomaly detection
22
20
20
We can test how much useful information is
retained in the bitmaps by using only the bitmaps
for clustering/classification/anomaly detection
19
19
17
17
18
18
16
16
8
8
7
7
10
10
9
9
6
6
15
15
Data Key
14
14
Cluster 1 (datasets 1 5) BIDMC Congestive
Heart Failure Database (chfdb) record chf02
Start times at 0, 82, 150, 200, 250,
respectively Cluster 2 (datasets 6 10) BIDMC
Congestive Heart Failure Database (chfdb) record
chf15 Start times at 0, 82, 150, 200, 250,
respectively Cluster 3 (datasets 11 15) Long
Term ST Database (ltstdb) record 20021 Start
times at 0, 50, 100, 150, 200, respectively Cluste
r 4 (datasets 16 20) MIT-BIH Noise Stress
Test Database (nstdb) record 118e6 Start times
at 0, 50, 100, 150, 200, respectively
12
12
13
13
11
11
5
5
4
4
3
3
2
2
1
1
23
We can test how much useful information is
retained in the bitmaps by using only the bitmaps
for clustering/classification/anomaly detection
24
Here is a Premature Ventricular Contraction (PVC)
Here the bitmaps are very different. This is the
most unusual section of the time series, and it
coincidences with the PVC.
Here the bitmaps are almost the same.
25
Annotations by a cardiologist
Premature ventricular contraction
Premature ventricular contraction
Supraventricular escape beat
26
Time Series Bitmaps Summary
The first paper to describe Time Series Bitmaps
appeared in SDM 05. There are lots of possible
ideas for extensions/ commercialization. Time
series bitmaps could be one of the few
contributions of data mining to make a real world
impact, because there is essentially no barrier
to adoption.
The greatest value of a picture is when it
forces us to notice what we never expected to
see John Turkey Exploring data analysis.
Addison-Wesley, Reading MA, 1977.
27
Using SAX to Visualize Time Series
28
Motivation of VizTree
10001000101001000101010100001010100010101110111101
01101001011101001010100111010101010010100101010111
01010100101010101101010100101100101110111101000111
00001010000100111010100011100001010101100101110101
01011001011110011010010000100010100110110101110000
10101011101111100011011011011111101001100100100011
01000111100110110100010111100010110100110110011010
00000100110001001110000011101001100101100001010010
Here are two sets of bit strings. Which set is
generated by a human and which one is generated
by a computer?
29
VizTree
10001000101001000101010100001010100010101110111101
01101001011101001010100111010101010010100101010111
01010100101010101101010100101100101110111101000111
00001010000100111010100011100001010101100101110101
01011001011110011010010000100010100110110101110000
10101011101111100011011011011111101001100100100011
01000111100110110100010111100010110100110110011010
00000100110001001110000011101001100101100001010010
0
0
1
0
0
1
1
1
Lets put the sequences into a depth limited tree,
such that the frequencies of all triplets are
encoded in the thickness of branches
humans usually try to fake randomness by
alternating patterns
30
VizTree
The trick on the previous slide only works for
discrete data, but time series are real valued.
Details 2
But we can SAX up a time series to make it
discrete!
Overview
Details 1
- VisTree
- Convert the time series to SAX
- Push the data in a depth-limited suffix tree
- Encode the frequencies as the line thickness
Overview, zoom filter, details on demand
31
SAX for Motif Discovery
32
SAX allows Motif Discovery!
Winding
Dataset
(
The angular speed of reel 2
)
0
50
0
1000
150
0
2000
2500
Informally, motifs are reoccurring patterns
33
Motif Discovery
To find these 3 motifs would require about
6,250,000 calls to the Euclidean distance
function.
34
Why Find Motifs?
- Mining association rules in time series
requires the discovery of motifs. These are
referred to as primitive shapes and frequent
patterns. - Several time series classification algorithms
work by constructing typical prototypes of each
class. These prototypes may be considered motifs.
- Many time series anomaly/interestingness
detection algorithms essentially consist of
modeling normal behavior with a set of typical
shapes (which we see as motifs), and detecting
future patterns that are dissimilar to all
typical shapes. - In robotics, Oates et al., have introduced a
method to allow an autonomous agent to generalize
from a set of qualitatively different experiences
gleaned from sensors. We see these experiences
as motifs. - In medical data mining, Caraca-Valente and
Lopez-Chavarrias have introduced a method for
characterizing a physiotherapy patients recovery
based of the discovery of similar patterns. Once
again, we see these similar patterns as motifs. - Animation and video capture (Tanaka and Uehara,
Zordan and Celly)
35
T
Trivial
Matches
Space Shuttle
STS
-
57
Telemetry
C
(
Inertial
Sensor
)
0
100
200
3
00
400
500
600
70
0
800
900
100
0
Definition 1. Match Given a positive real number
R (called range) and a time series T containing a
subsequence C beginning at position p and a
subsequence M beginning at q, if D(C, M) ? R,
then M is called a matching subsequence of
C. Definition 2. Trivial Match Given a time
series T, containing a subsequence C beginning at
position p and a matching subsequence M beginning
at q, we say that M is a trivial match to C if
either p q or there does not exist a
subsequence M beginning at q such that D(C, M)
gt R, and either q lt qlt p or p lt qlt
q. Definition 3. K-Motif(n,R) Given a time
series T, a subsequence length n and a range R,
the most significant motif in T (hereafter called
the 1-Motif(n,R)) is the subsequence C1 that has
highest count of non-trivial matches (ties are
broken by choosing the motif whose matches have
the lower variance). The Kth most significant
motif in T (hereafter called the K-Motif(n,R) )
is the subsequence CK that has the highest count
of non-trivial matches, and satisfies D(CK, Ci) gt
2R, for all 1 ? i lt K.
36
OK, we can define motifs, but how do we find them?
The obvious brute force search algorithm is just
too slow Our algorithm is based on a hot idea
from bioinformatics, random projection and the
fact that SAX allows use to lower bound discrete
representations of time series. J Buhler and M
Tompa. Finding motifs using random projections.
In RECOMB'01. 2001.
37
A simple worked example of our motif discovery
algorithm
The next 4 slides
T
(
m 1000
)
0
500
1000
C
1
a c b a
C
Assume that we have a time series T of length
1,000, and a motif of length 16, which occurs
twice, at time T1 and time T58.
1
S
a
c
b
a
1
b
c
a
b
2
a 3
a
,
b
,
c
n 16
w
4
a
c
c
a
58
b
c
c
c
985
38
A mask 1,2 was randomly chosen, so the values
in columns 1,2 were used to project matrix into
buckets.
Collisions are recorded by incrementing the
appropriate location in the collision matrix
39
Once again, collisions are recorded by
incrementing the appropriate location in the
collision matrix
A mask 2,4 was randomly chosen, so the values
in columns 2,4 were used to project matrix into
buckets.
40
We can calculate the expected values in the
matrix, assuming there are NO patterns
1
2
2
1
3
27
2
1
58
3
1
Suppose E(k,a,w,d,t) 2
2
2
3
1
0
2
1
98
5
1
2
58
98
5
41
A Simple Experiment
Lets imbed two motifs into a random walk time
series, and see if we can recover them
C
A
D
B
0
20
40
60
80
100
120
0
20
40
60
80
100
120
42
Planted Motifs
C
A
B
D
43
Real Motifs
0
20
40
60
80
100
120
0
20
40
60
80
100
120
44
Some Examples of Real Motifs
Astrophysics (
Photon Count)
250
350
450
550
650
0
0
0
0
0
45
Motifs in Music
jingle
- Single channel (mono) 225000 samples at sample
rate of 6000 samples/sec, 32bits per sample. - Pre-processing Absolute-valued and down-sampled
to total of 600 samples and new sample rate of 16
samples/sec. - 400 projections with instance length equal to 2
seconds of sample. w16, a8. - Jingle is highly repetitive, these motifs were
found
46
How Fast can we find Motifs?
10k
8k
Brute Force
6k
TS
-
P
Seconds
4k
2k
0
1000
2000
3000
4000
5000
Length of Time Series
47
The sun is setting on all other symbolic
representations of time series, we have seen SAX
for discord discovery, anomaly detection,
clustering and visualization
Recommended
