
Nutrient fluxes from coastal California PowerPoint PPT Presentation
1 / 37
Title: Nutrient fluxes from coastal California
1
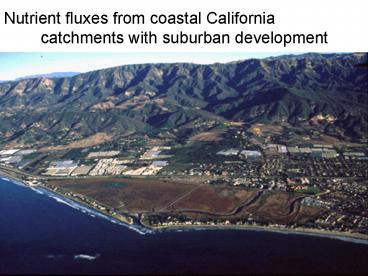
Nutrient fluxes from coastal California catchment
s with suburban development
2
Santa Barbara Channel LTER
Linking catchments to coastal waters
3
Objectives
- Examine episodic, seasonal and interannual
aspects of fluvial fluxes in catchments with
suburban development along the coast of central
California - Comparison to agricultural and chaparral
catchments
4
Coastal catchments of Santa Barbara Channel - New
Santa Barbara Channel
Los Angeles, CA
5
City of Santa Barbara, CA
Gaviota
Refugio
El Capitan
San Onofre
Arroyo Hondo
Bell
Mission
Devereux
Arroyo Burro
Tecolotito
Santa Monica Franklin
Carpinteria
Los Carneros
Rincon
Atascadero
Santa Barbara Channel
6
Land use among catchments
From West to East
7
Sub-Watershed Scale
8
Short streams steep terrain easily eroded
rock and soil flashy stormflow with lots of
sediment
9
- Hydrological and hydrochemical measurements
- Stage and temperature (continuous)
- Nitrate, ammonium, phosphate,
- dissolved nitrogen (weekly and event)
10
- Mediterranean climate Almost all the rainfall
occurs during 3 winter months - MoMediteranean climate Almost all the rainfall
occurs during 3 winter months - More than half of a years flow can occur during
one storm in less than 24 hrs. - re than half of a years flow can occur during
one storm in less than 24 hrs.
11
Single storm hydrograph and solute variations
12
(No Transcript)
13
Cumulative Export, Arroyo Burro Creek, WY 2001
14
Land use differences produce order-of-magnitude
variations in nutrient concentrations
15
WY 2001
Industrial Agriculture
Urban
Dissolved
Light Agriculture
Urban, Non-channelized
Particulate
16
Sampling Sites (Land Use Types)
T. Robinson 2006
17
Parcel Scale Residential Site
- T. Robinson 2006
18
Parcel Scale Greenhouse Site
- T. Robinson 2006
19
Nutrient Export by Land Use NO3-N
Annual
- T. Robinson 2006
20
Nutrient Export by Land Use PO4-P
Annual
- T. Robinson 2006
21
Hydrologic Modeling
- Compile/Develop Spatial Data
- Topography (DEM)
- Drainage Network (Stream and Drains)
- Land Use (Digital Images and Parcels)
- Soils (SSURGO)
- Estimate Rainfall Coverages
- Rain Gauge Network
- Orographic Enhancement
- Setup HEC-HMS Model
- Sub-divide watersheds
- Determine spatially averaged parameters
22
Hydrologic Model
- HEC-HMS Model
- Spatially averaged parameters
- Event based
- Surface Response
- Impervious surfaces
- Infiltration excess
- Subsurface Response
- Rapid shallow soil flow (interflow)
- Slower groundwater discharge (baseflow)
- Flow Routing
- Overland
- Channel
23
HEC-HMS Model Results
Mission Creek at Mission St. USGS Gauge No.
11119745 March 4-7, 2001
HEC-HMS Simulation
USGS Gauge Data
24
Regression models of export
- Models developed for annual, daily and storm
export - Based on area in agriculture,
- urban use (impervious surface),
- discharge
25
Interannual variations in nitrate fluxes among
catchments
26
Conclusions
- Large variations in N and P concentrations among
streams related to differences in coastal plain
land use - Export is determined by discharge with the few
large storms dominating annual flux - Runoff can be modeled on an individual storm
basis with rainfall data and catchment
characteristics - On-going measurements in nearshore waters and
models of nearshore physical processes will
integrate fluvial export with kelp ecosystem
function
27
The impact of fire on hydrology and suspended
sediment and nutrient export in southern
California chaparral watersheds
)
28
Gaviota Wildfire June 5 to 12, 2004
29
San Onofre Creek
Stream Sampling
February19, 2005
30
Stream Gauging
31
Changes to Hydrologic Response
- Infiltration decreases
- formation of hydrophobic soil layer
- compaction of soil
- Evapotranspiration and Interception decrease
- more rainfall is available for runoff
32
San Onofre Creek
October 26, 2004
October 19, 2004
November 15, 2004
December 28, 2004
33
San Onofre Creek
January 7, 2005
January 26, 2005
February 22, 2005
February19, 2005
April 27, 2005
34
Changes to Sediment Export
- Infiltration decreases
- Runoff and peak discharge increase
- Interception decreases due to vegetation loss
35
Sediment movement in San Onofre
Photos taken May 2005
36
Changes in Phosphate Export
- Phosphate is rapidly mineralized and deposited on
soil surface but is not as mobile as nitrate - Increases in phosphate concentration in runoff
roughly correlates with peak discharge
37
Summary of Results
- Hydrology
- Hydrologic response was typical for southern
California chaparral during early season storms
but differences decreased as the season
progressed with above average rainfall. - Suspended Sediment
- 10-fold increase in suspended sediment export
- Nutrients
- 30 times increase in ammonium export
- 5.5 times increase in nitrate export
- 2.8 times increase in DON export
- 2 times increase in phosphate export
Recommended
