
Graphing Rational Functions Example PowerPoint PPT Presentation
1 / 14
Title: Graphing Rational Functions Example
1
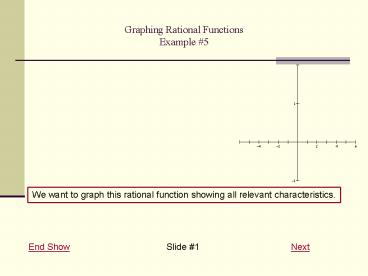
Graphing Rational FunctionsExample 5
We want to graph this rational function showing
all relevant characteristics.
End Show Slide 1 Next
2
Graphing Rational FunctionsExample 5
First we must factor both numerator and
denominator, but dont reduce the fraction
yet. Numerator Prime. Denominator Factor out
the GCF of x.
Previous Slide 2 Next
3
Graphing Rational FunctionsExample 5
Note the domain restrictions, where the
denominator is 0. Note that x2 1 is never 0 at
any real numbers.
Previous Slide 3 Next
4
Graphing Rational FunctionsExample 5
Now reduce the fraction. In this case, we cancel
the x.
Previous Slide 4 Next
5
Graphing Rational FunctionsExample 5
Any places where the reduced form is undefined,
the denominator is 0, forms a vertical asymptote.
Since x21 is never 0 for any real number, there
are no V.A.
Previous Slide 5 Next
6
Graphing Rational FunctionsExample 5
Any values of x that are not in the domain of the
function but are not V.A. form holes in the
graph. In other words, any factor that reduced
completely out of the denominator would create a
hole in the graph where it is 0.
Previous Slide 6 Next
7
Graphing Rational FunctionsExample 5
Since this example is undefined at 0, but there
are no V.A., there is a hole at x0. To find the
y-coordinate of the hole, plug 0 into the reduced
form.
Previous Slide 7 Next
8
Graphing Rational FunctionsExample 5
Next look at the degrees of both the numerator
and the denominator. Because the denominator's
degree, 3, is larger than the numerator's, 1, the
line y0 is automatically the horizontal
asymptote and there is no oblique asymptote.
Previous Slide 8 Next
9
Graphing Rational FunctionsExample 5
Since the H.A. is the x-axis, the intersections
with the H.A. are also the x-int. We find the
x-int. by solving when the function is 0 which
would be when the numerator is 0. Thus, when 10.
Since 1 is never 0, there are no x-int.
Previous Slide 9 Next
10
Graphing Rational FunctionsExample 5
Now find the y-intercept by plugging in 0 for
x. In this case, since the function is undefined
at x0, there isn't a y-intercept, but remember
that there is a hole on the y-axis.
Previous Slide 10 Next
11
Graphing Rational FunctionsExample 5
Plot any additional points needed. Here we dont
need any other points, but you can find some
other points if you want to.
Previous Slide 11 Next
12
Graphing Rational FunctionsExample 5
Finally draw in the curve. For the part to the
right of the y-axis, we use that it has to start
at (0,1), it can't cross the x-axis and it has to
approach the H.A.
Previous Slide 12 Next
13
Graphing Rational FunctionsExample 5
For the part to the left of the y-axis, we use
that it has to start at (0,1), it can't cross the
x-axis and it has to approach the H.A.
Previous Slide 13 Next
14
Graphing Rational FunctionsExample 5
This finishes the graph.
Previous Slide 14 End Show
Recommended
