
Problem 8 Graphical method PowerPoint PPT Presentation
1 / 13
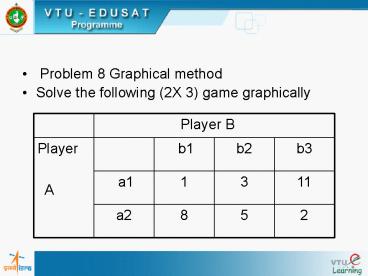
Title: Problem 8 Graphical method
1
- Problem 8 Graphical method
- Solve the following (2X 3) game graphically
2
- Problem 9
- Solve the following game graphically whose e
payoff matrix for the player A is given in the
table
3
Revision Transportation
- Given the following transportation problem
4
- Obtain the initial basic feasible solution by
VAM. Is the optimal solution obtained by you
unique? If not, what is the other optimal
solution?
5
- Assignment Assign the mechanics to the jobs .
6
Model 1Operating Characteristics
- Queue length
- average number of customers in queue waiting to
get service - System length
- average number of customers in the system
- Waiting time in queue
- average waiting time of a customer to get service
- Total time in system
- average time a customer spends in the system
- Server idle time
- relative frequency with which system is idle
7
- Measurement parameters
- ? mean number of arrivals per time period (eg.
Per hour) - µ mean number of customers served per time
period - Probability of system being busy/traffic
intensity - ? ? / µ
- Average waiting time system Ws 1/(µ- ?)
- Average waiting time in queue
- Wq ?/ µ(µ- ?)
- Average number of customers in the system
- Ls ?/ (µ- ?)
8
- Average number of customers in the queue
- Lq ?2/ µ(µ- ?)
- Probability of an empty facility/system being
idle - P(0) 1 P(w)
- Probability of being in the system longer than
time (t) - P(Tgtt) e (µ- ?)t
- Probability of customers not exceeding k in the
system - P (n.k) ?k
- P( ngtk) ?(k1)
- Probability of exactly N customers in the system
- P(N) ?N (1-?)
9
- Problem At a service counter of fast-food
joint, the customers arrive at the average
interval of six minutes whereas the counter
clerk takes on an average 5 minutes for
preparation of bill and delivery of the item.
Calculate the following - a. counter utilisation level
- b. average waiting time of the customers at the
fast food joint - c. Expected average waiting time in the line
10
- d. Average number of customers in the service
counter area - e. average number of customer in the line
- f. probability that the counter clerk is idle
- g. Probability of finding the clerk busy
- h. chances that customer is required to wait more
than 30 minutes in the system - i. probability of having four customer in the
system - J) probability of finding more than 3 customer in
the system
11
- Solutions Given ? 60/10 10 customer/hr
- µ 12 customer/hr
- A) traffic intensity ? ? / µ 10/12 0.833
- b) waiting time in the system
- Ws 1/ µ- ? 1/12-10 0.5 hr
- C) waiting time in the queue
- Wq ?/ µ (µ- ?) 10/12(12-10) 0.416 hr
- D) number of customer in the system
- Ls ?/ (µ- ?) 10/12-10 5 customers
- E) Number of customer in the queue
- Lq ?2 / µ (µ- ?) 102 /12(12-10) 4.167
customers
12
- f) probability that the counter clerk is idle
- 1- ? 1- ? / µ 1- 10/12 0.167
- g. Probability of finding the clerk busy
- ? ? / µ 10/12 0.833
- h) chances of probability that customer wait more
than 30min 30/60 0.5 hrs - P (Tgtt) e (µ- ?) t
- P (Tgt0.5) e (12- 10) 0.5 0.368
13
- I) probability of having four customer in the
system - P (N) ?N (1-?)
- P (4) ?4 (1-?) (0.833)4(1-0.833)
0.0806 - j) probability of finding more than 3 customer in
the system - P (ngtk) ? (k1)
- P (ngt3) ? (31) (? / µ) 4 (10/12) 4
- 0.474
Recommended
