
Cyanobacterial Blooms: Toxins, Tastes, and Odors - PowerPoint PPT Presentation
1 / 58
Title: Cyanobacterial Blooms: Toxins, Tastes, and Odors
1
Cyanobacterial Blooms Toxins, Tastes, and Odors
- USGS Kansas Water Science Center Algal Toxin Team
- Jennifer L. Graham, Keith A. Loftin,
- Michael T. Meyer, and Andrew C. Ziegler
- USDA-CSREES National Water Conference
- February 4, 2008
2
Overview
- Cyanobacterial (Blue-Green Algal) Toxins and
Taste-and-Odor Compounds - Microcystin in the Midwest
- Research Needs
- USGS Studies
3
Cyanobacterial toxins are anthropogenically
amplified, but basically a natural phenomenon
I. Chorus, 1993
4
- Ecologic Concerns
- Zooplankton avoidance or death
- Accumulation by mussels
- Fish kills
- Losses to bird and mammal populations
- Economic Concerns
- Added drinking water treatment costs
- Loss of recreational revenue
- Death of livestock and domestic animals
- Medical expenses
- Health Concerns
- Tastes-and-Odors
- Olfactory sensitivity at low concentrations (lt
0.01 µg/L) - Chronic effects?
- Toxins
- Human and animal illness and death
- EPA contaminant candidate list
- Drinking water - microcystin
- WHO guideline 1.0 µg/L
5
Toxins and Taste-and-Odor Compounds Produced by
Cyanobacteria
Dermatoxins Hepatotoxins Hepatotoxins Neurotoxins Neurotoxins Taste/Odor Taste/Odor
CYL MC ANA BMAA GEOS MIB
Colonial/Filamentous
Aphanizomenon X X X X X X
Anabaena X X X X X X ?
Cylindrospermopsis X X X
Microcystis X X X
Oscillatoria/Planktothrix X X X X X X
Unicellular
Synechococcus X X X X X
Synechocystis X X X
6
Cyanobacterial Toxins and Taste-and-Odor
Compounds Are Not Produced By The Same
Biochemical Pathway But Patterns in Distribution
Are Similar
- Extreme spatiotemporal variability
- Lack of relation with cyanobacterial community
composition or chlorophyll concentration - Coupling with lake/river processes as influenced
by physiochemical, biological, hydrological, and
meteorological factors
7
Cyanotoxins Exhibit a Wide Range of Toxicities
and Toxic Effects and Are Currently Listed on the
U.S. EPA Contaminant Candidate List
- Acute Toxicity
- Neurotoxic
- Hepatotoxic
- Dermatoxic
- Chronic Toxicity
- Carcinogen
- Tumor Promotion
- Mutagen
- Teratogen
- Embryolethality
After Chorus and Bartram, 1999
8
Cyanobacteria Made the News in at Least 21 U.S.
States During 2006
After Graham, 2006 USGS FS-2006-3147
9
At Least 35 U.S. States have Anecdotal Reports of
Human or Animal Poisonings Associated with
Cyanotoxins
10
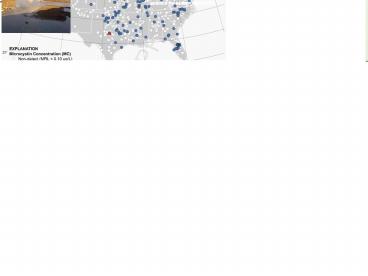
During 1999-2006 Microcystin was Detected in
INTEGRATED PHOTIC ZONE Samples from 78 of Lakes
(n359) and TOTAL Concentrations Ranged from lt0.1
to 52 µg/L
After Graham and others 2004 and 2006
11
Mean and Maximum TOTAL Microcystin Concentrations
Significantly Increased Along the Natural Trophic
Gradient in the Study Region
maxima
a, b, and c indicate significant differences in
mean concentration
Trophic Gradient
After Graham and others 2004 and 2006
12
80 of All Lakes Sampled During 1999-2006 Had
Maximum TOTAL Microcystin Concentrations 1
µg/L in Open Water Samples
After Graham and others 2004 and 2006
13
61 of Lakes Sampled During 3-6 Years Always Had
Detectable Microcystin During Summer, and
Microcystin Maxima Were Greatest in These Lakes
After Graham and others 2004 and 2006
14
Seasonal Patterns in Microcystin Concentration
are Unique to Individual Lakes and Peaks May
Occur Anytime Throughout the Year
15
Peak Microcystin Values May Occur in the Winter
Oscillatoria
2004
16
Seasonal Patterns Were Relatively Consistent
Between Years in Some Lakes
After Graham and Jones, 2006
17
Regionally, Microcystin Was Significantly
Correlated With Factors That Affect
Cyanobacterial Growth
Variable rs p-value n
Latitude 0.66 lt0.01 800
Total Nitrogen (TN) 0.58 lt0.01 795
Total Phosphorus (TP) 0.46 lt0.01 795
Secchi -0.27 lt0.01 796
pH 0.17 lt0.01 507
Alkalinity 0.15 lt0.01 432
TNTP -0.15 lt0.01 791
After Graham and others 2004
18
Regional Associations Between Microcystin and
Environmental Variables Were Complex
After Graham and others, 2004
19
Microcystin Was Not Strongly Correlated With
Measures of the Cyanobacterial Community
After Graham and others, 2004
20
Individual Lake Correlations Between Microcystin
and Environmental Variables Were Linear
After Graham and others, 2006
21
Seasonal Patterns in Individual Lakes are Coupled
with Seasonal Lake Processes, Including
Stratification and Nutrient Loss from the
Epilimnion
Cations
Nitrogen
Net Chlorophyll
Microcystin
After Graham and others, 2006
22
Factors Most Strongly Correlated With Microcystin
Vary Among Lakes and Years
23
Microcystin in Midwestern Lakes - Conclusions
- Microcystin is common in the Midwest and may
reach levels that can cause health concerns - Seasonal patterns in microcystin are unique to
individual lakes and maxima may occur in any
season - Regional relations between microcystin and
environmental variables are complex - Microcystin and environmental variables may be
tightly coupled in individual lakes, but
relations vary among lakes and years
Elysian Lake, MN Aug 2006
Binder Lake, IA Aug 2006
24
Research Needs
- Certified Standards
- Consistent Sampling Protocols
- Robust and Quantitative Analytical Methods for a
Variety of Toxins - Distribution of Microcystin Variants and Other
Cyanobacterial Toxins - Long Term Studies to Identify the Key
Environmental Factors Leading to
Toxic/Taste-and-Odor Producing Blooms - Methods for Early Detection
- Predictive Models
25
Consistent Sampling Protocols Sample Location
is Important
After Chorus and Bartram, 1999
26
Concentrations of Toxins and Taste-and-Odor
Compounds May Vary by Orders of Magnitude at
Different Sample Locations Within a Lake
Microcystin 13 µg/L Geosmin 0.25 µg/L
Microcystin 4 µg/L Geosmin Not Detected
Cheney Reservoir, KS September 2006
27
Actinomycetes Bacteria Also Produce Geosmin and
MIB and May Contribute to Taste-and-Odor Problems
in Drinking Water Supplies
28
Consistent Sampling Protocols Collection
Technique is Important
Plankton Net Sampling
Whole Water Sampling
Filter/Filtrate Sampling
29
Microcystin Concentrations Decreased with
Decreases in Cyanobacterial Size Class
Letters indicate significant differences in mean
concentration
Graham and Jones, 2007
30
Use of Plankton Nets Consistently Underestimated
Microcystin Concentrations Relative to Whole
Water Samples
Graham and Jones, 2007
31
There are Currently Over 80 Known Microcystin
Variants
From McKinnon, 2003
32
Analytical Methods for Cyanotoxins - Bioassays
- Bioassays
- Enzyme-linked
- immunosorbent assays
- (ELISA)
- - Microcystins/Nodularin
- - Cylindrospermopsins
- - Saxitoxins
- Inhibition Assays
- - Protein Phosphatase Inhibition
- (Microcystins/Nodularin)
- Radioassays
- - Neurotoxicity (Anatoxins/ Saxitoxins)
- Advantages
- Easy to Use
- Rapid
- Inexpensive
- Useful screening tools
- May indicate toxicity
- Disadvantages
- Cross-reactivity
- Matrix effects
- Semi-quantitative
- Radioassays use radio-labeled isotopes
33
Analytical Methods for Cyanotoxins Gas
Chromatography
Advantages Specificity Intermediate
cost Quantitative
Disadvantages Availability of analytical standards
Derivitization likely required Not all
compounds are amenable to derivitization GC-FID
requires further confirmation Sample
concentrating may be necessary
Gas Chromotography (GC) Flame ionization detector
(FID) Mass spectrometry (MS)
34
Analytical Methods for Cyanotoxins Liquid
Chromatography
- Advantages
- Specificity
- Derivitization not typically
- necessary
- Many toxins amenable to
- LC techniques
- Multi-analyte methods
- are cost-effective
- TOFMS good for
- determining unknowns
- (not quantitative)
Disadvantages Availability of analytical standards
Matrix effects Expensive Sample concentrating
may be necessary Spectroscopic techniques may
require further confirmation
Liquid Chromotography (LC) UV-Visible
(UV-Vis) Fluorescence Mass spectrometry
(MS) Tandem MS (MS/MS) Ion trap MS (ITMS) Time of
flight MS(TOFMS)
35
Robust and Quantitative Analytical Methods -
Capabilities of the USGS Organic Geochemistry
Research Laboratory
Geosmin and MIB MRL 5 ppt
http//ks.water.usgs.gov/Kansas/researchlab.html
36
Robust and Quantitative Analytical Methods -
Capabilities of the USGS Organic Geochemistry
Research Laboratory
MC-LY Deoxycylindrospermopsin Lyngbyatoxin-a Nodul
arin-R
Geosmin and MIB MRL 5 ppt
http//ks.water.usgs.gov/Kansas/researchlab.html
37
Total Microcystin Comparison ADDA Specific
ELISA vs LC/MS/MS for LR, -RR, -LY, -YR, -LA,
-LW, and LF variants
38
ELISA (ADDA) can be a useful tool in conjunction
with LC/MS/MS
39
Distribution of Microcystin Variants and Other
Cyanobacterial Toxins August 2006 Midwestern
Cyanotoxin Lake and Reservoir Reconnaissance
- Objectives
- Characterize occurrence and co-occurrence of
taste and odor compounds and cyanotoxins - Determine the specific toxins by LC/MS/MS
- Design
- States IA, KS, MN, MO (23 Lakes and Reservoirs)
- Targeted Sampling Blooms and Scums
- Analyses
- Taste and Odor SPME GC/MS
- Toxins TOTAL and Dissolved Concentrations
- ELISA Microcystins (ADDA), Microcystin LR,
Cylindrospermopsins, Saxitoxins - LC/MS/MS 7 microcystins (LR, RR, YR, LW, LA,
LF, LY), Nodularin, Anatoxin-a,
Cylindrospermopsin, Deoxycylindrospermopsin,
Lyngbyatoxin a - Water Chemistry
- Chlorophyll
- Phytoplankton
40
During August 2006 100 of BLOOMS Sampled (n23)
Had Detectable Microcystin, 83 Had Detectable
Geosmin, and 26 Had Detectable Anatoxin
41
TOTAL Microcystin Maxima (12,500 18,030 µg/L)
in BLOOM Samples Were Orders of Magnitude Greater
Than Maxima for Other Compounds (Anatoxin Maxima
13 µg/L, All Other Maxmima lt 1 µg/L)
42
During August 2006 Toxins and Taste-and-Odor
Compounds Co-Occurred in 87 of BLOOMS Sampled
(n23) and Anatoxin-a Always Co-Occurred with
Geosmin
43
During August 2006 Toxins and Taste-and-Odor
Compounds Co-Occurred in 87 of BLOOMS Sampled
(n23) and Anatoxin-a Always Co-Occurred with
Geosmin
Algae may make for stinky water, but it poses no
health risks
-Concord Monitor, Concord, NH July 7, 2006
44
Although Toxins and Taste-and-Odor Compounds
Frequently Co-Occurred Concentrations Were Not
Linearly Related
45
Cyanobacterial BLOOM with TOTAL Microcystin 0.6
µg/L, Anatoxin 0.1 µg/L , and Geosmin 0.02
µg/L
46
Cyanobacterial BLOOM with TOTAL Microcystin
12.3 µg/L, Nodularin 0.1 µg/L, Geosmin 0.02
µg/L, and MIB 0.06 µg/L
47
Cyanobacterial BLOOM with TOTAL Microcystin
18,000 µg/L, Cylindrospermopsin 0.12 µg/L
Saxitoxin 0.04 µg/L, and Geosmin 0.69 µg/L
48
Microcystin-LR and RR Were the Most Common
Microcystin Variants, and 41 of Lakes Had All 7
Measured Variants Present
49
Microcystin-LR and RR Comprised the Majority of
TOTAL Microcystin Concentrations
50
2006 Texas Reservoir Survey for DISSOLVED
Microcystin in Surface Samples at OPEN WATER
Locations
- Results
- 28 of reservoirs (n36) had
- detectable microcystin by ELISA
- Maximum DISSOLVED
- Microcystin concentrations lt 1 µg/L
- 69 of reservoirs had detectable
- MIB
- 30 of reservoirs had detectable
- Geosmin
After Kiesling and others, in prep
51
Microcystins and Taste-and-Odor Compounds
Frequently Co-Occurred in Texas Reservoirs
After Kiesling and others, in prep
52
2007 US EPA National Lake Assessment 1200 Lakes
and ReservoirsTOTAL Microcystin in Integrated
Photic Zone Samples
- Preliminary Results
- 33 of samples (n711) had
- detectable microcystin by ELISA
- Mean TOTAL microcystin
- concentration 0.97 µg/L
- Maximum TOTAL microcystin
- concentration 74 µg/L
53
Sample Location and Type are Important
Study Sample Location Sample Type n Samples with MC Maximum MC (µg/L)
Graham and others 1999-2006 Open Water, Integrated Photic Total 2546 39 52
Midwest Recon 2006 Targeted Blooms, Bloom Grab Total 23 96 12,500
Texas Recon 2006 Open Water, Surface Grab Dissolved 67 22 0.2
EPA NLA 2007 Open Water, Integrated Photic Total 711 33 74
Microcystin was measured by ELISA in all studies
54
Long Term Studies Assessment of Water Quality
in the North Fork Ninnescah River and Cheney
Reservoir, 1997-Present
- Concerns
- Taste-and-odor occurrences related to algal
blooms - Relation between watershed inputs and
- taste-and-odor causing algae
- Approach
- Describe current and historical loading inflow
- Sediment Cores
- Continuous Water-Quality Monitoring
- Describe physical, chemical, and biological
processes associated with cyanobacteria and
cyanobacterial by-products - Discrete Samples
- Real-Time Monitors
North Fork Ninnescah River March 2006
Cheney Reservoir, KS June 2003 Photo Courtesy of
KDHE
http//ks.water.usgs.gov/Kansas/studies/qw/cheney/
55
Early Detection and Predictive Models
Continuous Real-Time Water-Quality Monitors
- Real-Time Variables
- Specific conductance, pH, temperature, turbidity,
dissolved oxygen - Chlorophyll
- Light
- Blue-green algae
- Nitrate
The J. W. Powell USGS Monitoring Station on Lake
Houston, Texas Station Developed by Michael J.
Turco, Timothy D. Oden, William H. Asquith,
Jeffery W. East, and Michael R. Burnich
http//waterdata.usgs.gov/tx/nwis/
56
Continuous Monitoring Allows the Identification
and Description of Events that Occur Within
Relatively Short Periods of Time
http//waterdata.usgs.gov/tx/nwis/
57
Early Detection - Geosmin Concentrations in
Cheney Reservoir Frequently Exceed the Human
Detection Limit of 10 ng/L
log10(Geo) 7.2310 - 1.0664 log10(Turb) - 0.0097
SC r20.71
Geosmin
Estimated Geosmin Concentration (µg/L)
http//ks.water.usgs.gov/Kansas/rtqw/index.shtml
Estimated Geosmin Concentration 2003
http//ks.water.usgs.gov/Kansas/rtqw/index.shtml
After Christensen and others, 2006 USGS SIR
2006-5095
58
Keith Loftinkloftin_at_usgs.gov(785) 832-3543
Jennifer Graham jlgraham_at_usgs.gov (785) 832-3511
Additional Information Available on the
Web Cyanobacteria - http//ks.water.usgs.gov/Kan
sas/studies/qw/cyanobacteria Cheney -
http//ks.water.usgs.gov/Kansas/studies/qw/cheney
Olathe - http//ks.water.usgs.gov/Kansas/studies/
qw/olathe RTQW - http//ks.water.usgs.gov/Kansas/r
tqw/index.shtml
Recommended
CrystalGraphics Presentations


