
Slajd 1 PowerPoint PPT Presentation
Title: Slajd 1
1
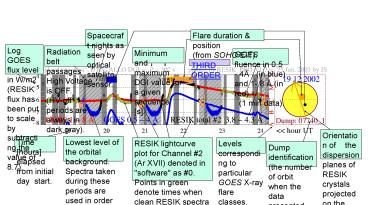
Spacecraft nights as seen by optical satellite
sensor.
Flare duration position (from SOHO EIT).
Log GOES flux level in W/m2 (RESIK flux has been
put to scale by subtracting the value of 8.7).
Radiation belt passages High Voltage is
OFF. (HV-off periods are always in dark gray).
Minimum and maximum DGI value for a given
sequence s.
GOES fluence in 0.5 - 4Å (in blue) and 1- 8 Å
(in red) (1 min data).
THIRD ORDER
Orientation of the dispersion planes of RESIK
crystals projected on the Sun (heliographic
coordinates).
Time hours elapsed from initial day start.
Lowest level of the orbital background. Spectra
taken during these periods are used in order to
subtract the background emission.
RESIK lightcurve plot for Channel 2 (Ar XVII)
denoted in "software" as 0. Points in green
denote times when clean RESIK spectra are
available. Points in black are rejected from the
summed spectra, while points in light brown
correspond to periods when the satellite is in
the auroral regions emission due to in-situ X-ray
emission.
Levels corresponding to particular GOES X-ray
flare classes.
Dump identification (the number of orbit
when the data presented were sent to the ground).
Recommended
