
CICEET - PowerPoint PPT Presentation
1 / 66
Title: CICEET
1
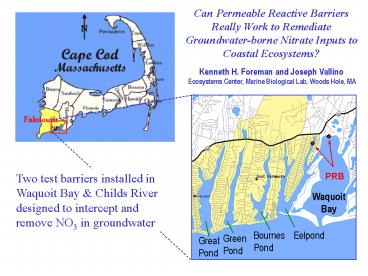
Can Permeable Reactive Barriers Really Work to
Remediate Groundwater-borne Nitrate Inputs to
Coastal Ecosystems?Kenneth H. Foreman and
Joseph Vallino Ecosystems Center, Marine
Biological Lab, Woods Hole, MA
Waquoit Bay
Eelpond
Bournes Pond
Green Pond
Great Pond
2
Basic Concept Reactive Barrier composed of
coarse mix of wood chips buffered with limestone
(Nitrex TM) permeable to groundwater installed
above high tide level to stimulate
denitrification in the groundwater by providing
Carbon Substate? 5CH2O4NO3- 5CO2 2N2
3H2O 4OH-
3
History of Development on Seacoast Shores
Peninsula on Childs River
1938
1950s
1990s 1000 homes Sewering this penninsula may
cost gt60,000,000
4
History of Nutrient Loading to Waquoit
Bay Wastewater has become dominant source of
nitrogen to bay, but still only
accounts for about half the N-load
From Bowen and Valiela, 2001. Can. Journal of
Fish Aquatic Science
5
Will treating just the wastewater input be
sufficient to cure the eutrophication
problem? What about the multi-year legacy of
contaminated groundwater?
- A permeable reactive barrier, if it works, would
- capture all sources of groundwater-borne N to
estuary - become effective immediately
- discharge at the site of origin
- be cheaper to build and operate than
centralized sewers
6
Questions/Concerns Will barrier capture most of
groundwater flow at shore? Will barrier work
efficiently at low NO3 (1-3 mg/L) found in
groundwater? How important are biomass
immobilization dissimilatory NO3 reduction to
NH3 compared to denitrification in removing
NO3? What will be effect of tidal inundation,
high SO4 storms? What will effects of seepage
of anoxic groundwater be on shoreline ecosystems
fauna?
7
In Waquoit Bay conditions are ideal for testing
PRB concept
Groundwater at the shore confined to depth of
4-6 meters and is underlain by saline
water Most groundwater seepage occurs along beach
between high and low tide lines. Salinity
contours in parts per thousand.
From Kroeger et al. Woods Hole Oceanographic
Institution
8
PZ1 PZ2 PZ3 PZ4
0 m 4 m 8 m
12 m
Distribution of NO3- in groundwater / sediment
porewaters at head of Waquoit Bay Contour Plot
shows concentrations in µmoles per liter
High Tide
Low Tide
18 35 9 90 126 189 211 37 0 00 0 0
0 0 0 0
27 67 49 105 150 213 164 23 0 0 0 0 0
0 0 0 0
40
0 m 2 m 4 m 6 m 8 m
126 125 193 160 5 0 0 0 0 0 0 0 0
0
0 0 1 0 0 0 1 0 0 0 0 0 0 0 1 0 3
100
120
160
120
Saline
Data from Kroeger et al. Woods Hole Oceanographic
Institution
9
PRB Installations (NITREXTM)
Childs River Installed Jul 2005 Length 12
m Width 1.8 m Depth 1.5 m
WBNERR Installed Aug 2005 Length 20
m Width 3.7 m Depth 2.0 m
10
Filling Trench with Woods Chips (NitrexTM)
11
Covering Woods Chips with Geotextile Cloth and
Sand (0.5-1 m )
12
Remove shoring, move down the beach
13
Sampling Layout Permanent Wells and Wellpoints
14
Well and wellpoint sampling at the barrier
15
Dissolve Oxygen
Sampling November 2005 (3.5 mos after
installation)Beach Cross-section showing network
of multidepth well sample points across barrier
(orange box) Dissolved Oxygen conc. (
saturation)
Waquoit Bay
16
November 2005, 3.5 months after
installationGroundwater Nitrate Removal in
Waquoit Bay PRB
Waquoit Bay
17
Salinity November 2005, 3.5 mos after
installation
18
(No Transcript)
19
Neap Tide Nov 16/21 2006 15 mos after
installation Specific Conductivity (mS/cm)
20
Spring Tide Dec 6, 2006 Specific Conductivity
(mS/cm)
21
Neap Tide 16/21 November 2006 Dissolved Oxygen
(mg/liter)
NOTE Black circle around data point denotes
sample taken 21 Nov 06
22
Spring Tide 5 December 2006 Dissolved Oxygen
(mg/liter)
23
Does NO3 make it to the seepage face? Wellpoint
sampling August 2007 (24 months) clearly shows
NO3 removal downgradient from barrier
24
Where did the Nitrate Go?
- Three possible fates
- Denitrification
- 5CH2O4NO3- 5CO2 2N2 3H2O 4OH-
- 2. Dissimilatory Nitrate Reduction to Ammonia
(DNRA) - NO3- 2H 2CH2O 2CO2 NH4 H2O
- 3. N-immobilization in microbial biomass and
complexation of N in refractory organic compounds
25
Tracer Experiment (Nov 2007)
Add 2 liter spike of 500 mmolar 15NO3 together
with 40 mmolar KBr conservative tracer to 1.75 m
depth of central well in barrier adjacent beach
control sites. ? Use Br - to assess
dispersion, ? Measure NO3 (correct for dilution
/ dispersion, estimate loss), ? Take gas samples
to measure excess N2 formed
Cross-section view Aerial view
Injection point
26
Direct measures of denitrification Membrane
Inlet Mass Spectrometer data on dissolved N2/Ar
Ratios
Ratios gt equilibrium indicate excess N2
- possible sources
- denitrification
- excess air injection
- during GW formation
Ratio 28N2/40Ar
Baseline ratio in water at equilibrium
34.51 Ratio in air 801
Runtime on Mass Spectrometer ?
27
Use 15N tracer to definitively assess
denitrification415NO3- 4H 5CH2O ? 5CO2
230N2 7H2O
MIMS voltage signal
Run time (hr of day)
28
Microcosm Experiments
- Treatments
- Groundwater spiked to concentration of 250 mM
NO3- - Saltwater (30 psu) spiked to concentration of 250
mM NO3- - Alternating Tidal (seawater 4 hr every 12 hr)
with Groundwater (average salinity 10 psu)
spiked to 250 mM NO3-
29
In
Out
30
Ammonium produced in seawater microcosms accounts
for 1-5 of NO3 input. Suggests DNRA, though
occurring, not major fate
31
(No Transcript)
32
(No Transcript)
33
Possible Decomposition Processes producing DIC
- Aerobic Respiration
- CH2O O2 ? CO2 H2O
- Denitrification
- 4NO3- 4H 5CH2O ? 5CO2 2N2 7H2O
- Sulfate reduction
- SO42- 2CH2O 2H ? 2CO2 H2S 2H2O
- Dissimilatory NO3 Reduction to Ammonia (DNRA)
- NO3- 2H 2CH2O ? 2CO2 NH4 H2O
- Fermentation Reactions
34
(No Transcript)
35
Direct estimate of Denitrification from N2/Ar
determined using Membrane Inlet Mass Spectrometer
(MIMS) and differences between
N2outflow - N2inflow in microcsoms
Corrected for excess air injection using Arout
relative to expected equilibrium concentration
following Bohlke et al. (Appl. Geochem. 2006)
Inflow N2 estimated used weighted average of
two inputs
36
Down-gradient Effects of Barrier Pt electrode
measurements of Redox Potentional (Eh) lower Eh
values high sulfide activities and indicates
anoxia
37
Clam (Mya arenaria) Growth Experiments
Barrier
Barrier
Control
Average linear growth per week, by site and
treatment, of Mya arenaria collected from Waquoit
Bay in October 2007 after 3.0 months in the
field. Error bars indicate /- 1 standard error
for the growth period. Data courtesy Maggie
Waldron (Lawrence University)
38
Upper
Middle
Lower
39
(No Transcript)
40
Conclusions What we have learned and ??
remaining
- Barrier does capture most (gt95) NO3 flowing
in groundwater at shore. - Zone of influence extends beyond barrier
(downgradient and below) - Although barrier removes NO3 efficiently,
perhaps only 50-25 of removal is - due to denitrification.
- Barrier has altered hydrology resulting in
higher salinity in porewaters. - High SO4 from seawater intrusion increases
decomposition rate, shortening - barrier life resulting in release of
sulfides along seepage face therefore - barrier should be installed to minimize
seawater infiltration. - Anoxic groundwater affects narrow zone along
beach seepage face but effects - probably minimal compared with nutrient
release on salt pond ecosystems. - Other concerns relative to centralized treatment
what about permitting, - pharmaceuticals and other (currently
unregulated) compounds in domestic - waste stream?
41
Thanks to Cooperative Institute for Coastal and
Estuarine Environmental Technology (CICEET)
Collaborators Joe Vallino Pio Lombardo Rich
McHorney Jane Tucker (MIMS)
Students Sabrina Moreau (Hampshire College) Jen
Reimer (Clark University) Mark Andersen (San
Francisco State) Whitney Eng (Brown
University) Kaitlyn Lucey (Wellesley
College) Angela Vincent (Grinnell College) Maggie
Waldron (Lawrence University) Lauren Bizzari
(Colby College) Megan Carpenter (Lafayette
College)
42
Not necessary to ring entire coastline with
barriers
West Falmouth Harbor Thermal Image
33ºC 25 ºC
43
West Falmouth Harbor shore wells groundwater NO3
Foreman and McHorney, unpublished
44
Not necessary to ring entire coastline with
barriers
West Falmouth Harbor Thermal Image
33ºC 25 ºC
45
Quantifying Nitrogen Loading
- N-Load Natm deposition NSFH wastewater
Ncommercial wastewater Nfertilizer - N atm deposition 11 kg ha-1 y-1 on Cape Cod
area of watershed - N SFH wastewater number people annual per
capita N release - Number people number single family homes
occupancy - Assume 1.8 people per household 4.8 kg N
per person per yr - or assume per capita water use of 110 gpd (416
l/d) and effluent conc. 35 mg N/l - N commercial ppty units flow conc, or
area flow/unit area - Assume daily flow of 1775 gpd (10,000 ft2) for
annual load of 6 kg N/yr - N fertilizer on lawns rate ha-1 y-1 area
lawns households fertilizing - Assume 115 kg N ha-1 y-1, average lawn 0.05
ha, 35 households fertilize - N fertilizer on agricultural golf courses
rate ha-1 y-1 area
46
Attenuation fate of inputs differ depending on
where and how they enter the watershed
See also Collins, G. J. Kremer, I. Valiela
(2000). Assessing Uncertainty in Estimates of
Nitrogen Loading to Estuaries for Research,
Planning and Risk Assessment . Env. Management
25 635-645
47
From Valiela et al. 2000 Biogeochemistry
48
(No Transcript)
49
(No Transcript)
50
Cg. Ctl. Ctl. Cg. Bar. Barrier All Ctl. All
Barrier
51
(No Transcript)
52
History
- 1981 Wastewater Facilities plan recommended
- construction of a treatment plant to clean
up wastewater from downtown Falmouth, Woods Hole,
which had disposed of wastewater through an
outfall pipe since 1949 - siting facility on moraine in watershed of
West Falmouth Harbor . - to include portions of Falmouth Heights
and the Maravista Penninsula - 1986 Wastewater treatment plant completed
- currently treats on average about 440,000
gpd of wastewater - 26,000 gpd of septage from the rest of the
town. - 2001 Wastewater Facilities plan recommended
- sewering along north Davis Straits and Jones
Rd. to Maravista Ave, - improvements to wastewater plant to achieve
N-removal - sewering in the West Falmouth Harbor
watershed west of Rt. 28. - Land Purchases for wastewater disposal and
treatment facilities - 23.7 acres in East Falmouth extending from Rt.
28 near Falmouth - Lumber to Brick Kiln Rd. (Augusta
Realty) 3 million 1.5 million - from the Air Force Center for
Environmental Excellence (AFCEE). - 224 acres in Hatchville (Falmouth Country Club)
for 15.8 million
53
Flow path of groundwater NO3 under the PRB
16/21 Nov 06
Relative Elevation (meters)
5 Dec 06
Relative Distance (meters)
54
H2S and percent dsrAB gene abundance
dsrAB gene abundance () 16 Nov 06
circled points were collected 21 Nov 06
55
SO42- 2CH2O 2H ? 2CO2 H2S 2H2O
56
DIC from SO42- reduction ()
circled points were collected 21 Nov 06
57
In
Seawater Tidal Groundwater
Out
58
SPRING
59
NEAP
NOTE Black circle around data point denotes
sample taken 21 Nov 06
60
Liters
61
(No Transcript)
62
Between 100 and 75 of wastewater N must be
removed from lower watersheds to achieve MEP
Comprehensive Wastewater Management Plan
Stearns and Wheler was hired as the consultant.
Two reports generated November 2007
- Needs Assessment
- Alternative Screening Analysis
MEP process and general recognition of problem
stimulated Town of Falmouth to commission an
engineering study to begin developing a
town-wide, comprehensive plan for nutrient
management and remediation. Major focus is on
identifying and prioritizing sewer service areas
for Little Pond, Great Pond, Green Pond, Bournes
Pond, Eelpond and Waquoit Bay
63
(No Transcript)
64
Results from Wellpoint sampling at low tide line
along the beach 71 mM 1 mg/l
Nitrate at Childs River
65
Specifically, MEP uses a linked watershed /
estuary model to predict the water quality
changes that will result from land use management
decisions and determine
- what the nutrient sources are.
- the geographic area (watershed) contributing
nutrients to a specific estuary. - what the nutrient load is.
- amount of nutrient loading estuaries can tolerate
without dramatically changing their character. - Based on this information recommend Total Maximum
Daily Load (TMDL) of nutrients (N)
66
Centralized treatment is costly to build and
operate, requires abandoning existing septic
system infrastructure and finding suitable
disposal sites for effluent. Is there another
way?-
Recommended
CrystalGraphics Presentations


![Full Guide on Samsung Data Recovery [Updated] PowerPoint PPT Presentation](https://s3.amazonaws.com/images.powershow.com/9355974.th0.jpg?_=20191101043)


![5 Ways on How to Retrieve Deleted Videos on Samsung Galaxy [Must Read] PowerPoint PPT Presentation](https://s3.amazonaws.com/images.powershow.com/9396892.th0.jpg?_=20200209102)


