
University of Chicago PowerPoint PPT Presentation
Title: University of Chicago
1
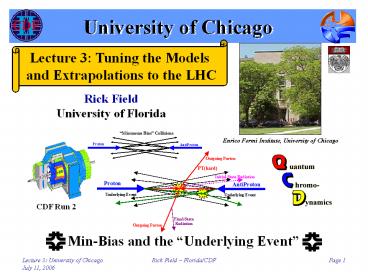
University of Chicago
Lecture 3 Tuning the Models and Extrapolations
to the LHC
Rick Field University of Florida
Enrico Fermi Institute, University of Chicago
CDF Run 2
2
Particle Densities
Charged Particles pT gt 0.5 GeV/c h lt 1
CDF Run 2 Min-Bias
DhDf 4p 12.6
CDF Run 2 Min-Bias Observable Average Average Density per unit h-f
Nchg Number of Charged Particles (pT gt 0.5 GeV/c, h lt 1) 3.17 /- 0.31 0.252 /- 0.025
PTsum (GeV/c) Scalar pT sum of Charged Particles (pT gt 0.5 GeV/c, h lt 1) 2.97 /- 0.23 0.236 /- 0.018
- Study the charged particles (pT gt 0.5 GeV/c, h
lt 1) and form the charged particle density,
dNchg/dhdf, and the charged scalar pT sum
density, dPTsum/dhdf.
3
Transverse Particle Densities
Charged Particles pT gt 0.5 GeV/c h lt 1
Area 4p/6
- Study the charged particles (pT gt 0.5 GeV/c, h
lt 1) in the Transverse 1 and Transverse 2 and
form the charged particle density, dNchg/dhdf,
and the charged scalar pT sum density,
dPTsum/dhdf.
- The average transverse density is the average
of transverse 1 and transverse 2.
4
QCD Monte-Carlo ModelsHigh Transverse Momentum
Jets
Underlying Event
- Start with the perturbative 2-to-2 (or sometimes
2-to-3) parton-parton scattering and add initial
and final-state gluon radiation (in the leading
log approximation or modified leading log
approximation).
- The underlying event consists of the beam-beam
remnants and from particles arising from soft or
semi-soft multiple parton interactions (MPI).
The underlying event is an unavoidable
background to most collider observables and
having good understand of it leads to more
precise collider measurements!
- Of course the outgoing colored partons fragment
into hadron jet and inevitably underlying
event observables receive contributions from
initial and final-state radiation.
5
Evolution of Charged JetsUnderlying Event
Charged Particle Df Correlations PT gt 0.5 GeV/c
h lt 1
Look at the charged particle density in the
transverse region!
Transverse region very sensitive to the
underlying event!
CDF Run 1 Analysis
- Look at charged particle correlations in the
azimuthal angle Df relative to the leading
charged particle jet. - Define Df lt 60o as Toward, 60o lt Df lt 120o
as Transverse, and Df gt 120o as Away. - All three regions have the same size in h-f
space, DhxDf 2x120o 4p/3.
6
Run 1 PYTHIA Tune A
CDF Default!
PYTHIA 6.206 CTEQ5L
Parameter Tune B Tune A
MSTP(81) 1 1
MSTP(82) 4 4
PARP(82) 1.9 GeV 2.0 GeV
PARP(83) 0.5 0.5
PARP(84) 0.4 0.4
PARP(85) 1.0 0.9
PARP(86) 1.0 0.95
PARP(89) 1.8 TeV 1.8 TeV
PARP(90) 0.25 0.25
PARP(67) 1.0 4.0
Run 1 Analysis
- Plot shows the transverse charged particle
density versus PT(chgjet1) compared to the QCD
hard scattering predictions of two tuned versions
of PYTHIA 6.206 (CTEQ5L, Set B (PARP(67)1) and
Set A (PARP(67)4)).
Old PYTHIA default (more initial-state radiation)
Old PYTHIA default (more initial-state radiation)
New PYTHIA default (less initial-state radiation)
New PYTHIA default (less initial-state radiation)
7
Transverse Charged Particle Density
Transverse region as defined by the leading
charged particle jet
Excellent agreement between Run 1 and 2!
- Shows the data on the average transverse charge
particle density (hlt1, pTgt0.5 GeV) as a
function of the transverse momentum of the
leading charged particle jet from Run 1.
- Compares the Run 2 data (Min-Bias, JET20, JET50,
JET70, JET100) with Run 1. The errors on the
(uncorrected) Run 2 data include both statistical
and correlated systematic uncertainties.
PYTHIA Tune A was tuned to fit the underlying
event in Run I!
- Shows the prediction of PYTHIA Tune A at 1.96 TeV
after detector simulation (i.e. after CDFSIM).
8
The Transverse Regionsas defined by the
Leading Jet
Charged Particle Df Correlations pT gt 0.5 GeV/c
h lt 1
Look at the charged particle density in the
transverse region!
Transverse region is very sensitive to the
underlying event!
- Look at charged particle correlations in the
azimuthal angle Df relative to the leading
calorimeter jet (JetClu R 0.7, h lt 2). - Define Df lt 60o as Toward, 60o lt -Df lt 120o
and 60o lt Df lt 120o as Transverse 1 and
Transverse 2, and Df gt 120o as Away. Each
of the two transverse regions have area DhDf
2x60o 4p/6. The overall transverse region is
the sum of the two transverse regions (DhDf
2x120o 4p/3).
9
Charged Particle Density Df Dependence
Refer to this as a Leading Jet event
Subset
Refer to this as a Back-to-Back event
- Look at the transverse region as defined by the
leading jet (JetClu R 0.7, h lt 2) or by the
leading two jets (JetClu R 0.7, h lt 2).
Back-to-Back events are selected to have at
least two jets with Jet1 and Jet2 nearly
back-to-back (Df12 gt 150o) with almost equal
transverse energies (ET(jet2)/ET(jet1) gt 0.8)
and with ET(jet3) lt 15 GeV.
- Shows the Df dependence of the charged particle
density, dNchg/dhdf, for charged particles in the
range pT gt 0.5 GeV/c and h lt 1 relative to
jet1 (rotated to 270o) for 30 lt ET(jet1) lt 70
GeV for Leading Jet and Back-to-Back events.
10
Transverse PTsum Density vs ET(jet1)
Leading Jet
Back-to-Back
Min-Bias 0.24 GeV/c per unit h-f
- Shows the average charged PTsum density,
dPTsum/dhdf, in the transverse region (pT gt 0.5
GeV/c, h lt 1) versus ET(jet1) for Leading
Jet and Back-to-Back events.
- Compares the (uncorrected) data with PYTHIA Tune
A and HERWIG (without MPI) after CDFSIM.
11
Latest CDF Run 2 Underlying Event Results
The underlying event consists of the beam-beam
remnants and possible multiple parton
interactions, but inevitably received
contributions from initial and final-state
radiation.
Transverse region is very sensitive to the
underlying event!
Latest CDF Run 2 Results (L 385 pb-1)
- Two Classes of Events Leading Jet and
Back-to-Back. - Two Transverse regions transMAX, transMIN,
transDIF. - Data Corrected to the Particle Level unlike our
previous CDF Run 2 underlying event analysis
which used JetClu to define jets and compared
uncorrected data with the QCD Monte-Carlo models
after detector simulation, this analysis uses the
MidPoint jet algorithm and corrects the
observables to the particle level. The corrected
observables are then compared with the QCD
Monde-Carlo models at the particle level. - For the 1st time we study the energy density in
the transverse region.
12
TransMAX/MIN PTsum Density PYTHIA Tune A vs
HERWIG
PYTHIA Tune A does a fairly good job fitting the
PTsum density in the transverse region! HERWIG
does a poor job!
Back-to-Back
Leading Jet
- Shows the charged particle PTsum density,
dPTsum/dhdf, in the transMAX and transMIN
region (pT gt 0.5 GeV/c, h lt 1) versus PT(jet1)
for Leading Jet and Back-to-Back events. - Compares the (corrected) data with PYTHIA Tune A
(with MPI) and HERWIG (without MPI) at the
particle level.
13
TransMAX/MIN ETsum Density PYTHIA Tune A vs
HERWIG
Back-to-Back
Leading Jet
Neither PY Tune A or HERWIG fits the ETsum
density in the transferse region! HERWIG does
slightly better than Tune A!
- Shows the data on the tower ETsum density,
dETsum/dhdf, in the transMAX and transMIN
region (ET gt 100 MeV, h lt 1) versus PT(jet1)
for Leading Jet and Back-to-Back events. - Compares the (corrected) data with PYTHIA Tune A
(with MPI) and HERWIG (without MPI) at the
particle level (all particles, h lt 1).
14
TransDIF ETsum Density PYTHIA Tune A vs HERWIG
Leading Jet
Back-to-Back
transDIF is more sensitive to the hard
scattering component of the underlying event!
- Use the leading jet to define the MAX and MIN
transverse regions on an event-by-event basis
with MAX (MIN) having the largest (smallest)
charged PTsum density.
- Shows the transDIF MAX-MIN ETsum density,
dETsum/dhdf, for all particles (h lt 1) versus
PT(jet1) for Leading Jet and Back-to-Back
events.
15
Possible Scenario??
- PYTHIA Tune A fits the charged particle PTsum
density for pT gt 0.5 GeV/c, but it does not
produce enough ETsum for towers with ET gt 0.1 GeV.
- It is possible that there is a sharp rise in the
number of particles in the underlying event at
low pT (i.e. pT lt 0.5 GeV/c).
- Perhaps there are two components, a vary soft
beam-beam remnant component (Gaussian or
exponential) and a hard multiple interaction
component.
16
TransMAX/MIN ETsum Density PYTHIA Tune A vs
JIMMY
JIMMY was tuned to fit the energy density in the
transverse region for leading jet events!
JIMMY MPI J. M. Butterworth J. R. Forshaw M. H.
Seymour
Leading Jet
Back-to-Back
- Shows the ETsum density, dETsum/dhdf, in the
transMAX and transMIN region (all particles
h lt 1) versus PT(jet1) for Leading Jet and
Back-to-Back events. - Compares the (corrected) data with PYTHIA Tune A
(with MPI) and a tuned version of JIMMY (with
MPI, PTJIM 3.25 GeV/c) at the particle level.
17
TransMAX/MIN Nchg Density PYTHIA Tune A vs
JIMMY
Back-to-Back
Leading Jet
- Shows the charged particle density, dNchg/dhdf,
in the transMAX and transMIN region (pT gt 0.5
GeV/c, h lt 1) versus PT(jet1) for Leading
Jet and Back-to-Back events. - Compares the (corrected) data with PYTHIA Tune A
(with MPI) and a tuned version of JIMMY (with
MPI, PTJIM 3.25 GeV/c) at the particle level.
18
Transverse ltPTgt PYTHIA Tune A vs JIMMY
Back-to-Back
Leading Jet
- Shows the charged particle ltPTgt in the
transverse (pT gt 0.5 GeV/c, h lt 1) versus
PT(jet1) for Leading Jet and Back-to-Back
events. - Compares the (corrected) data with PYTHIA Tune A
(with MPI) and HERWIG and a tuned version of
JIMMY (with MPI, PTJIM 3.25 GeV/c) at the
particle level.
Both JIMMY and HERWIG are too soft for pT gt 0.5
GeV/c!
19
CDF Run 1 PT(Z)
PYTHIA 6.2 CTEQ5L
UE Parameters
Parameter Tune A Tune A25 Tune A50
MSTP(81) 1 1 1
MSTP(82) 4 4 4
PARP(82) 2.0 GeV 2.0 GeV 2.0 GeV
PARP(83) 0.5 0.5 0.5
PARP(84) 0.4 0.4 0.4
PARP(85) 0.9 0.9 0.9
PARP(86) 0.95 0.95 0.95
PARP(89) 1.8 TeV 1.8 TeV 1.8 TeV
PARP(90) 0.25 0.25 0.25
PARP(67) 4.0 4.0 4.0
MSTP(91) 1 1 1
PARP(91) 1.0 2.5 5.0
PARP(93) 5.0 15.0 25.0
ISR Parameter
- Shows the Run 1 Z-boson pT distribution (ltpT(Z)gt
11.5 GeV/c) compared with PYTHIA Tune A
(ltpT(Z)gt 9.7 GeV/c), Tune A25 (ltpT(Z)gt
10.1 GeV/c), and Tune A50 (ltpT(Z)gt 11.2
GeV/c).
Vary the intrensic KT!
Intrensic KT
20
CDF Run 1 PT(Z)
Tune used by the CDF-EWK group!
PYTHIA 6.2 CTEQ5L
Parameter Tune A Tune AW
MSTP(81) 1 1
MSTP(82) 4 4
PARP(82) 2.0 GeV 2.0 GeV
PARP(83) 0.5 0.5
PARP(84) 0.4 0.4
PARP(85) 0.9 0.9
PARP(86) 0.95 0.95
PARP(89) 1.8 TeV 1.8 TeV
PARP(90) 0.25 0.25
PARP(62) 1.0 1.25
PARP(64) 1.0 0.2
PARP(67) 4.0 4.0
MSTP(91) 1 1
PARP(91) 1.0 2.1
PARP(93) 5.0 15.0
UE Parameters
ISR Parameters
- Shows the Run 1 Z-boson pT distribution (ltpT(Z)gt
11.5 GeV/c) compared with PYTHIA Tune A
(ltpT(Z)gt 9.7 GeV/c), and PYTHIA Tune AW
(ltpT(Z)gt 11.7 GeV/c).
Effective Q cut-off, below which space-like
showers are not evolved.
Intrensic KT
The Q2 kT2 in as for space-like showers is
scaled by PARP(64)!
21
Jet-Jet Correlations (DØ)
- MidPoint Cone Algorithm (R 0.7, fmerge 0.5)
- L 150 pb-1 (Phys. Rev. Lett. 94 221801 (2005))
- Data/NLO agreement good. Data/HERWIG agreement
good. - Data/PYTHIA agreement good provided PARP(67)
1.0?4.0 (i.e. like Tune A, best fit 2.5).
22
CDF Run 1 PT(Z)
PYTHIA 6.2 CTEQ5L
Parameter Tune DW Tune AW
MSTP(81) 1 1
MSTP(82) 4 4
PARP(82) 1.9 GeV 2.0 GeV
PARP(83) 0.5 0.5
PARP(84) 0.4 0.4
PARP(85) 1.0 0.9
PARP(86) 1.0 0.95
PARP(89) 1.8 TeV 1.8 TeV
PARP(90) 0.25 0.25
PARP(62) 1.25 1.25
PARP(64) 0.2 0.2
PARP(67) 2.5 4.0
MSTP(91) 1 1
PARP(91) 2.1 2.1
PARP(93) 15.0 15.0
UE Parameters
ISR Parameters
- Shows the Run 1 Z-boson pT distribution (ltpT(Z)gt
11.5 GeV/c) compared with PYTHIA Tune DW, and
HERWIG.
Tune DW uses D0s perfered value of PARP(67)!
Intrensic KT
Tune DW has a lower value of PARP(67) and
slightly more MPI!
23
Transverse Nchg Density
PYTHIA 6.2 CTEQ5L
Three different amounts of MPI!
UE Parameters
Parameter Tune AW Tune DW Tune BW
MSTP(81) 1 1 1
MSTP(82) 4 4 4
PARP(82) 2.0 GeV 1.9 GeV 1.8 GeV
PARP(83) 0.5 0.5 0.5
PARP(84) 0.4 0.4 0.4
PARP(85) 0.9 1.0 1.0
PARP(86) 0.95 1.0 1.0
PARP(89) 1.8 TeV 1.8 TeV 1.8 TeV
PARP(90) 0.25 0.25 0.25
PARP(62) 1.25 1.25 1.25
PARP(64) 0.2 0.2 0.2
PARP(67) 4.0 2.5 1.0
MSTP(91) 1 1 1
PARP(91) 2.5 2.5 2/5
PARP(93) 15.0 15.0 15.0
ISR Parameter
- Shows the transverse charged particle density,
dN/dhdf, versus PT(jet1) for leading jet
events at 1.96 TeV for PYTHIA Tune A, Tune AW,
Tune DW, Tune BW, and HERWIG (without MPI).
- Shows the transverse charged particle density,
dN/dhdf, versus PT(jet1) for leading jet
events at 1.96 TeV for Tune DW, ATLAS, and HERWIG
(without MPI).
Three different amounts of ISR!
Intrensic KT
24
Transverse PTsum Density
PYTHIA 6.2 CTEQ5L
Three different amounts of MPI!
UE Parameters
Parameter Tune AW Tune DW Tune BW
MSTP(81) 1 1 1
MSTP(82) 4 4 4
PARP(82) 2.0 GeV 1.9 GeV 1.8 GeV
PARP(83) 0.5 0.5 0.5
PARP(84) 0.4 0.4 0.4
PARP(85) 0.9 1.0 1.0
PARP(86) 0.95 1.0 1.0
PARP(89) 1.8 TeV 1.8 TeV 1.8 TeV
PARP(90) 0.25 0.25 0.25
PARP(62) 1.25 1.25 1.25
PARP(64) 0.2 0.2 0.2
PARP(67) 4.0 2.5 1.0
MSTP(91) 1 1 1
PARP(91) 2.5 2.5 2/5
PARP(93) 15.0 15.0 15.0
ISR Parameter
- Shows the transverse charged PTsum density,
dPT/dhdf, versus PT(jet1) for leading jet
events at 1.96 TeV for PYTHIA Tune A, Tune AW,
Tune DW, Tune BW, and HERWIG (without MPI).
- Shows the transverse charged PTsum density,
dPT/dhdf, versus PT(jet1) for leading jet
events at 1.96 TeV for Tune DW, ATLAS, and HERWIG
(without MPI).
Three different amounts of ISR!
Intrensic KT
25
PYTHIA 6.2 Tunes
PYTHIA 6.2 CTEQ5L
s(MPI) at 1.96 TeV s(MPI) at 14 TeV
Tune A 309.7 mb 484.0 mb
Tune DW 351.7 mb 549.2 mb
Tune DWT 351.7 mb 829.1 mb
ATLAS 324.5 mb 768.0 mb
Parameter Tune A Tune DW Tune DWT ATLAS
MSTP(81) 1 1 1 1
MSTP(82) 4 4 4 4
PARP(82) 2.0 GeV 1.9 GeV 1.9409 GeV 1.8 GeV
PARP(83) 0.5 0.5 0.5 0.5
PARP(84) 0.4 0.4 0.4 0.5
PARP(85) 0.9 1.0 1.0 0.33
PARP(86) 0.95 1.0 1.0 0.66
PARP(89) 1.8 TeV 1.8 TeV 1.96 TeV 1.0 TeV
PARP(90) 0.25 0.25 0.16 0.16
PARP(62) 1.0 1.25 1.25 1.0
PARP(64) 1.0 0.2 0.2 1.0
PARP(67) 4.0 2.5 2.5 1.0
MSTP(91) 1 1 1 1
PARP(91) 1.0 2.1 2.1 1.0
PARP(93) 5.0 15.0 15.0 5.0
CDF Run 2 Data!
- Shows the transverse charged particle density,
dN/dhdf, versus PT(jet1) for leading jet
events at 1.96 TeV for Tune A, DW, ATLAS, and
HERWIG (without MPI).
- Shows the transverse charged PTsum density,
dPT/dhdf, versus PT(jet1) for leading jet
events at 1.96 TeV for Tune A, DW, ATLAS, and
HERWIG (without MPI).
- Shows the transverse charged average pT, versus
PT(jet1) for leading jet events at 1.96 TeV
for Tune A, DW, ATLAS, and HERWIG (without MPI).
Identical to DW at 1.96 TeV but uses ATLAS
extrapolation to the LHC!
26
MIT Search Scheme 12
Exclusive 3 Jet Final State Challenge
CDF Data
At least 1 Jet (trigger jet) (PT gt 40 GeV/c,
h lt 1.0)
Normalized to 1
PYTHIA Tune A
Exactly 3 jets (PT gt 20 GeV/c, h lt 2.5)
R(j2,j3)
Order Jets by PT Jet1 highest PT, etc.
27
3Jexc R(j2,j3) Normalized
The data have more 3 jet events with small
R(j2,j3)!?
- Let Ntrig40 equal the number of events with at
least one jet with PT gt 40 geV and h lt 1.0
(this is the offline trigger).
- Let N3Jexc20 equal the number of events with
exactly three jets with PT gt 20 GeV/c and h lt
2.5 which also have at least one jet with PT gt 40
GeV/c and h lt 1.0.
Normalized to N3JexcFr
- Let N3JexcFr N3Jexc20/Ntrig40. The is the
fraction of the offline trigger events that are
exclusive 3-jet events.
- The CDF data on dN/dR(j2,j3) at 1.96 TeV compared
with PYTHIA Tune AW (PARP(67)4), Tune DW
(PARP(67)2.5), Tune BW (PARP(67)1).
- PARP(67) affects the initial-state radiation
which contributes primarily to the region
R(j2,j3) gt 1.0.
28
3Jexc R(j2,j3) Normalized
I do not understand the excess number of
events with R(j2,j3) lt 1.0. Perhaps this is
related to the soft energy problem?? For now
the best tune is PYTHIA Tune DW.
- Let Ntrig40 equal the number of events with at
least one jet with PT gt 40 geV and h lt 1.0
(this is the offline trigger).
- Let N3Jexc20 equal the number of events with
exactly three jets with PT gt 20 GeV/c and h lt
2.5 which also have at least one jet with PT gt 40
GeV/c and h lt 1.0.
Normalized to N3JexcFr
- Let N3JexcFr N3Jexc20/Ntrig40. The is the
fraction of the offline trigger events that are
exclusive 3-jet events.
- The CDF data on dN/dR(j2,j3) at 1.96 TeV compared
with PYTHIA Tune DW (PARP(67)2.5) and HERWIG
(without MPI).
- Final-State radiation contributes to the region
R(j2,j3) lt 1.0.
- If you ignore the normalization and normalize all
the distributions to one then the data prefer
Tune BW, but I believe this is misleading.
29
The Underlying Event inHigh PT Jet Production
(LHC)
Charged particle density versus PT(jet1)
The Underlying Event
Underlying event much more active at the LHC!
- Charged particle density in the Transverse
region versus PT(jet1) at 1.96 TeV for PY Tune
AW and HERWIG (without MPI).
- Charged particle density in the Transverse
region versus PT(jet1) at 14 TeV for PY Tune AW
and HERWIG (without MPI).
30
QCD Monte-Carlo ModelsLepton-Pair Production
Underlying Event
- Start with the perturbative Drell-Yan muon pair
production and add initial-state gluon radiation
(in the leading log approximation or modified
leading log approximation).
- The underlying event consists of the beam-beam
remnants and from particles arising from soft or
semi-soft multiple parton interactions (MPI).
- Of course the outgoing colored partons fragment
into hadron jet and inevitably underlying
event observables receive contributions from
initial and final-state radiation.
31
The Central Regionin Drell-Yan Production
Look at the charged particle density and the
PTsum density in the central region!
Charged Particles (pT gt 0.5 GeV/c, h lt 1)
After removing the lepton-pair everything else is
the underlying event!
- Look at the central region after removing the
lepton-pair. - Study the charged particles (pT gt 0.5 GeV/c, h
lt 1) and form the charged particle density,
dNchg/dhdf, and the charged scalar pT sum
density, dPTsum/dhdf, by dividing by the area in
h-f space.
32
Drell-Yan Production (Run 2 vs LHC)
Lepton-Pair Transverse Momentum
ltpT(mm-)gt is much larger at the LHC!
Shapes of the pT(mm-) distribution at the
Z-boson mass.
Z
- Average Lepton-Pair transverse momentum at the
Tevatron and the LHC for PYTHIA Tune DW and
HERWIG (without MPI).
- Shape of the Lepton-Pair pT distribution at the
Z-boson mass at the Tevatron and the LHC for
PYTHIA Tune DW and HERWIG (without MPI).
33
The Underlying Event inDrell-Yan Production
The Underlying Event
Charged particle density versus M(pair)
HERWIG (without MPI) is much less active than PY
Tune AW (with MPI)!
Underlying event much more active at the LHC!
Z
Z
- Charged particle density versus the lepton-pair
invariant mass at 1.96 TeV for PYTHIA Tune AW and
HERWIG (without MPI).
- Charged particle density versus the lepton-pair
invariant mass at 14 TeV for PYTHIA Tune AW and
HERWIG (without MPI).
34
Extrapolations to the LHCDrell-Yan Production
Charged particle density versus M(pair)
The Underlying Event
Tune DW and DWT are identical at 1.96 TeV, but
have different MPI energy dependence!
Z
Z
- Average charged particle density versus the
lepton-pair invariant mass at 1.96 TeV for PYTHIA
Tune A, Tune AW, Tune BW, Tune DW and HERWIG
(without MPI).
- Average charged particle density versus the
lepton-pair invariant mass at 14 TeV for PYTHIA
Tune DW, Tune DWT, ATLAS and HERWIG (without
MPI).
35
Extrapolations to the LHCDrell-Yan Production
Charged particle charged PTsum density versus
M(pair)
The Underlying Event
The ATLAS tune has a much softer distribution
of charged particles than the CDF Run 2 Tunes!
Z
Z
- Average charged PTsum density versus the
lepton-pair invariant mass at 14 TeV for PYTHIA
Tune DW, Tune DWT, ATLAS and HERWIG (without
MPI).
- Average charged PTsum density versus the
lepton-pair invariant mass at 1.96 TeV for PYTHIA
Tune A, Tune AW, Tune BW, Tune DW and HERWIG
(without MPI).
36
Extrapolations to the LHCDrell-Yan Production
Charged particle density versus M(pair)
The Underlying Event
The ATLAS tune has a much softer distribution
of charged particles than the CDF Run 2 Tunes!
Charged Particles (hlt1.0, pT gt 0.5 GeV/c)
Charged Particles (hlt1.0, pT gt 0.9 GeV/c)
Z
Z
- Average charged particle density (pT gt 0.5 GeV/c)
versus the lepton-pair invariant mass at 14 TeV
for PYTHIA Tune DW, Tune DWT, ATLAS and HERWIG
(without MPI).
- Average charged particle density (pT gt 0.9 GeV/c)
versus the lepton-pair invariant mass at 14 TeV
for PYTHIA Tune DW, Tune DWT, ATLAS and HERWIG
(without MPI).
37
Proton-AntiProton Collisionsat the Tevatron
The CDF Min-Bias trigger picks up most of the
hard core cross-section plus a small amount of
single double diffraction.
stot sEL sIN
stot sEL sSD sDD sHC
1.8 TeV 78mb 18mb 9mb
(4-7)mb (47-44)mb
CDF Min-Bias trigger 1 charged particle in
forward BBC AND 1 charged particle in backward BBC
The hard core component contains both hard
and soft collisions.
Beam-Beam Counters 3.2 lt h lt 5.9
38
CDF Min-Bias DataCharged Particle Density
ltdNchg/dhgt 4.2
ltdNchg/dhdfgt 0.67
- Shows CDF Min-Bias data on the number of
charged particles per unit pseudo-rapidity at 630
and 1,800 GeV. There are about 4.2 charged
particles per unit h in Min-Bias collisions at
1.8 TeV (h lt 1, all PT).
- Convert to charged particle density, dNchg/dhdf,
by dividing by 2p. There are about 0.67 charged
particles per unit h-f in Min-Bias collisions
at 1.8 TeV (h lt 1, all PT).
39
CDF Min-Bias DataEnergy Dependence
LHC?
- Shows the center-of-mass energy dependence of the
charged particle density, dNchg/dhdf, for
Min-Bias collisions at h 0. Also show a log
fit (Fit 1) and a (log)2 fit (Fit 2) to the CDF
plus UA5 data.
- What should we expect for the LHC?
40
PYTHIA Tune A Min-BiasSoft Hard
Tuned to fit the underlying event!
PYTHIA Tune A CDF Run 2 Default
12 of Min-Bias events have PT(hard) gt 5 GeV/c!
1 of Min-Bias events have PT(hard) gt 10 GeV/c!
- PYTHIA regulates the perturbative 2-to-2
parton-parton cross sections with cut-off
parameters which allows one to run with PT(hard)
gt 0. One can simulate both hard and soft
collisions in one program.
Lots of hard scattering in Min-Bias!
- The relative amount of hard versus soft
depends on the cut-off and can be tuned.
- This PYTHIA fit predicts that 12 of all
Min-Bias events are a result of a hard 2-to-2
parton-parton scattering with PT(hard) gt 5 GeV/c
(1 with PT(hard) gt 10 GeV/c)!
41
PYTHIA Tune ALHC Min-Bias Predictions
LHC?
- Shows the center-of-mass energy dependence of the
charged particle density, dNchg/dhdf, for
Min-Bias collisions compared with PYTHIA Tune A
with PT(hard) gt 0.
- PYTHIA was tuned to fit the underlying event in
hard-scattering processes at 1.8 TeV and 630 GeV.
- PYTHIA Tune A predicts a 42 rise in dNchg/dhdf
at h 0 in going from the Tevatron (1.8 TeV) to
the LHC (14 TeV). Similar to HERWIG soft
min-bias, 4 charged particles per unit h becomes
6.
42
PYTHIA Tune ALHC Min-Bias Predictions
12 of Min-Bias events have PT(hard) gt 10 GeV/c!
LHC?
- Shows the center-of-mass energy dependence of the
charged particle density, dNchg/dhdfdPT, for
Min-Bias collisions compared with PYTHIA Tune A
with PT(hard) gt 0.
1 of Min-Bias events have PT(hard) gt 10 GeV/c!
- PYTHIA Tune A predicts that 1 of all Min-Bias
events at 1.8 TeV are a result of a hard 2-to-2
parton-parton scattering with PT(hard) gt 10 GeV/c
which increases to 12 at 14 TeV!
43
PYTHIA 6.2 TunesLHC Min-Bias Predictions
- Shows the predictions of PYTHIA Tune A, Tune DW,
Tune DWT, and the ATLAS tune for the charged
particle density dN/dh and dN/dY at 14 TeV (all
pT).
- PYTHIA Tune A and Tune DW predict about 6 charged
particles per unit h at h 0, while the ATLAS
tune predicts around 9.
- PYTHIA Tune DWT is identical to Tune DW at 1.96
TeV, but extrapolates to the LHC using the ATLAS
energy dependence.
44
PYTHIA 6.2 TunesLHC Min-Bias Predictions
- Shows the predictions of PYTHIA Tune A, Tune DW,
Tune DWT, and the ATLAS tune for the charged
particle pT distribution at 14 TeV (h lt 1) and
the average number of charged particles with pT gt
pTmin (h lt 1).
- The ATLAS tune has many more soft particles
than does any of the CDF Tunes. The ATLAS tune
has ltpTgt 548 MeV/c while Tune A has ltpTgt 641
MeV/c (100 MeV/c more per particle)!
45
Summary
More work needs to be done in comparing the
various tunes at the LHC. The ATLAS tune cannot
be right because it does not fit the
Tevatron data. Right now I like Tune
DW. Probably no tune will fit the LHC data. That
is why we plan to measure MBUE at CMS and retune
the Monte-Carlo models!
- PYTHIA Tune A does not produce enough soft
energy in the underlying event! JIMMY 325
(PTJIM 3.25 GeV/c) fits the energy in the
underlying event but does so by producing too
many particles (i.e. it is too soft).
- The ATLAS tune is goofy! It produces too many
soft particles. The charged particle ltpTgt is
too low and does not agree with the CDF Run 2
data. The ATLAS tune agrees with ltNchggt but not
with ltPTsumgt at the Tevatron.
- PYTHIA Tune DW is very similar to Tune A except
that it fits the CDF PT(Z) distribution and it
uses the DØ prefered value of PARP(67) 2.5
(determined from the dijet Df distribution).
- PYTHIA Tune DWT is identical to Tune DW at 1.96
TeV but uses the ATLAS energy extrapolation to
the LHC (i.e. PARP(90) 0.16).
46
Conclusions
I think more work needs to be done in comparing
the various tunes. The ATLAS tune cannot be
right because it does not fit the Tevatron data.
Right now I like Tune DW. Probably no tune will
fit the CMS data. That is why we want to measure
MBUE at CMS and retune the Monte-Carlo models!
Tevatron LHC
- We cannot use the new underlying event model in
PYTHIA 6.3. It has not been studied (and tuned)
well enough yet!
- The ATLAS tune is goofy! It produces too many
soft particles. The charged particle ltpTgt is
too low and does not agree with the CDF Run 2
data. The ATLAS tune agrees with ltNchggt but not
with ltPTsumgt at the Tevatron.
- PYTHIA Tune DW is very similar to Tune A except
that it fits the CDF PT(Z) distribution and it
uses the DØ prefered value of PARP(67) 2.5
(determined from the dijet Df distribution).
- PYTHIA Tune DWT is identical to Tune DW at 1.96
TeV but uses the ATLAS energy extrapolation to
the LHC (i.e. PARP(90) 0.16).
Recommended
