
Graphing: Line Graphs PowerPoint PPT Presentation
1 / 2
Title: Graphing: Line Graphs
1
Graphing Line Graphs
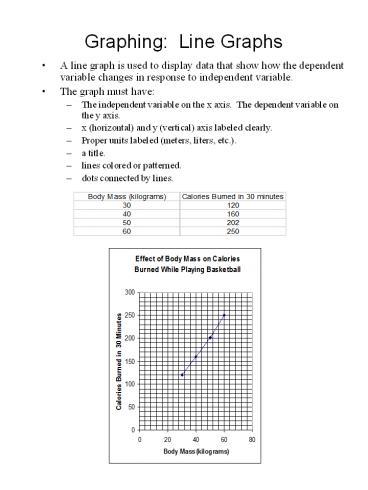
- A line graph is used to display data that show
how the dependent variable changes in response to
independent variable. - The graph must have
- The independent variable on the x axis. The
dependent variable on the y axis. - x (horizontal) and y (vertical) axis labeled
clearly. - Proper units labeled (meters, liters, etc.).
- a title.
- lines colored or patterned.
- dots connected by lines.
2
Your Assignment
- You must make a line graph using the data below.
Be sure to follow the guidelines on the front of
this sheet.
Time running Calories burned
15 90
30 180
45 270
60 360
75 450
Recommended
