
Optimal Bank Loan Portfolio Hedging A Practitioners Perspective PowerPoint PPT Presentation
1 / 10
Title: Optimal Bank Loan Portfolio Hedging A Practitioners Perspective
1
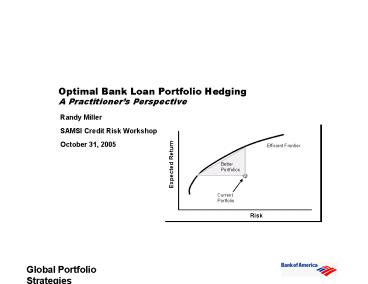
Optimal Bank Loan Portfolio Hedging A
Practitioners Perspective
- Randy Miller
- SAMSI Credit Risk Workshop
- October 31, 2005
2
Desirable Performance through the Credit Cycle
Earnings Path through Credit Cycle
Time
Evidence suggests underperformance in Region 2 is
more important to PE Multiple than
underperformance in Region 1
3
An Interdependent Two Part Hedging ProblemHold
to Maturity Loan Book and Mark-to-Market Credit
Derivatives Book
Hold to Maturity Loan Book Accrual Accounting
Credit Derivatives Book Mark to Market Accounting
- Objective
- Manage default and downgrade risk of credit risk
concentrations - Reduce earnings volatility through the credit
cycle - Improve portfolio efficiency
- Method
- Single name credit derivatives
- Size of Hedgeable Loan Book
- 100 billion notional
- 1500 names
- Key Questions
- How much?
- Priority?
- Objective
- Manage PL volatility
- Method
- Single name credit derivatives
- Size of Long CDS Book
- 15 billion notional
- 300-500 names
- Key Questions
- Best Short CDS Hedge Portfolio
Accounting Asymmetry
- Limited liquidity
- Limited price discovery
- Limited time series
CHALLENGES
4
An Optimal Benchmark to Guide HTM Portfolio
Rebalancing StrategiesUsing Asset Allocation
Approach to Address How Much? Priority?
Dominated by Concentrated High Yield Portfolios
2,050
2,000
1,950
1,900
Expected Total Credit Return In USD mm
1,850
1,800
?
1,750
?
Current HTM Portfolio
1,700
Minimum Risk Benchmark
1,650
700
900
1,100
1,300
Risk expressed as CVAR in USD mm
- Minimum Risk Benchmark
- An efficient portfolio with respect to risk
appetite and pl aspirations - A benchmark index to guide strategy and to track
performance
5
A Scenario Based Optimization ModelWhat Do We
Optimize Against?
- Scenario based optimization model is
implementation of Conditional Value at Risk
(CVAR) approach discussed in Rockafellar, R.T.
and Uryasev, S., Optimization of Conditional
Value at Risk, mimeo, September 5, 1999 and in
related papers - Focus on CVAR as risk measure
- Addresses skewed credit return distribution
- Addresses risks of greatest concern to the bank
- CVAR
- Coherent
- Mathematically tractable and intuitive wrt
decomposition and analysis of risk drivers
- Credit risk attributes (Merton Structural Model
Framework) - Default probabilities (Mark to Model valuation
under the risk neutral measure) - Loss Given Default
- Loan Equivalent Exposure Based on Usage Given
Default - Correlation structure based on KMV asset return
factor model estimated over period 1988-2002 - Expected credit migration based on bond migration
data - Expected benchmark portfolio performance meets
business plan objectives - Benchmark subject to selected prudential, and
generally nonbinding, policy and business
constraints
6
Two Stage Optimization ProcedureAddressing the
Optimal Portfolio Cherry-Picking Problem
- Stage 1
- Segment by Industry and Debt Rating
- Simulate and Optimize Under Infinite Granularity
- Stage 2
- Construct Replicating Portfolio
- Portfolio Performance Metrics
- Overweight/Underweight Names
- Risk and Return Contribution
7
Liquid and Nonliquid Risk Mitigation Opportunities
Risk Mitigation Performance Metrics
Portfolio March, 2005
290
Benchmark
Current HTM
280
Nonliquid
Opportunity
270
Current Risk
Mitigation Impact
260
MTM Return (millions)
Current HTM Liquid Bmk CDS
250
Current HTM Current CDS
Liquid CDS
240
Opportunity
230
220
1,025
1,075
1,125
1,175
1,225
1,275
1,325
1,375
1,425
Risk - CVAR95 (millions)
March, 2005 ( millions )
Headline Risk (Cmt gt 300mm)
Total Commitment
Expected MTM PL
Risk (CVAR)
Return/Risk Ratio
Count
Total Cmt
Average Cmt
Benchmark
123,403
284
1,185
0.240
56
27,067
483
Current Hold to Maturity (No CDS)
114,262
284
1,346
0.211
64
40,969
640
Current HTM Current CDS
102,479
252
1,202
0.210
58
33,800
583
Current HTM Liquid Bmk CDS
97,199
258
1,044
0.247
53
29,715
561
8
Hedging PL Volatility in the Credit Derivatives
BookConstruct a Portfolio of Short CDS Positions
65th-80th Percentile
Credit Derivatives Book Returns Long CDS Short
Credit Risk
- Hedge Default Events Separately (How?)
- Deal with Cost of Carry Separately
- Minimize Shortfall Risk (What Percentile?)
- Minimize Tracking Error
- Position Size Limited by Willingness to Take on
More Credit Exposure in a Name
9
Hedging Expected Performance Analysis
Optimal short CDS portfolio constructed under
tracking error minimization
10
Performance Trade-offCredit Derivatives versus
Hold to Maturity Book
Recommended
