
Suppliers Manufacturing Distribution Channelsretailers End users PowerPoint PPT Presentation
1 / 9
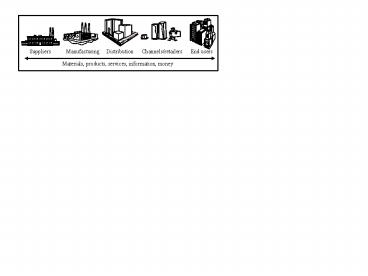
Title: Suppliers Manufacturing Distribution Channelsretailers End users
1
Suppliers Manufacturing
Distribution Channels/retailers End
users
Materials, products, services, information, money
2
0.4
0.76
Quantity produced
0.74
0.35
0.75
0.3633
0.3438
0.72
0.3
0.3125
0.7
0.25
Market Price
0.68
0.25
Price
0.6875
0.2
Total Quantity Produced
0.66
0.15
0.6563
0.64
0.1
0.6367
0.62
0.05
0.6
0
0.58
1
2
3
4
Number of Periods
3
0.7
nN-3
0.6
nN-2
0.5
nN-1
0.4
Price
nN
0.3
0.2
0.1
0
1
2
3
4
Number of Periods
4
- Tactical Planning
Start-ups
- Synchronize demand and supply
- Critical Insights
- Improved Utilization
i2, SAP-APO
- Execution
- Enhanced off-the-shelf software
- Tracking
- Visibility
- Planning
Oracle, SAP
- Protocols for Efficient SCM
- Tracking
YesterdayBackbone
Today Execution
Tomorrow Collaboration
5
RS
162.5
150
p1
15
16.39
6
S
CS
Reservation price, ? Spot market price, ?
F
P(Q) a bQ
7
F determines QF(?, ?) and SF(?, ?)
F determines RF(?, ?)
Period 1
Period 2
S announces ? and ?
8
F determines QF(?, ?) and SF(?, RF)
F determines RF(?)
Period 1
Period 2
S announces ?
S announces ?(RF)
9
Figure 1 In a traditional supply chain raw
materials enter at one end and finished goods
reach the consumer at the other end.
Figure 2 As the number of periods increases, the
total quantity increases and the market price of
the product decreases.
Figure 3 The top point on the vertical line
corresponds to the reservation price and the
bottom one corresponds to the last spot market
price. As the number of periods for spot markets
increases, the last spot markets price decreases.
Figure 4 New Internet technologies enable
supply-chain collaboration
Figure 5 Revenue of the supplier initially
increases in price and then remains constant in
the first step of the auction
Figure 6 Model parameters and decision variables
Figure 7 Timeline of credible commitment case
Figure 8 Timeline of sequential pricing case
Recommended
