
Graphing a Sine Curve PowerPoint PPT Presentation
1 / 11
Title: Graphing a Sine Curve
1
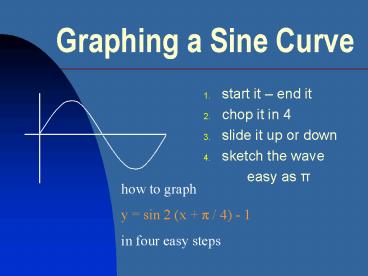
Graphing a Sine Curve
- start it end it
- chop it in 4
- slide it up or down
- sketch the wave
- easy as p
how to graph y sin 2 (x p / 4) - 1 in four
easy steps
2
Here's what we know
3
Here's What We'll Do
1 - find where it starts at h and ends at h
period 2 - chop the interval into 4 equal parts 3
- slide it up or down according to k and a 4 -
draw the curve.
h
h 2p / b
4
Step 1 start it end it
y a sin b ( x h ) k parameters h and b are
the horizontal sliders we set the horizontal
sliders first
On the x-axis, we'll start at h, then slide 2p /
b units right
5
Step 1 start it end it horizontal sliders
- y sin 2 ( x p/4 ) 1
- phase shift h - p/4
- slide the initial point p/4 units left
- period 2p / b 2p / 2 p
- slide p units right to cycle's end
6
horizontal sliders setting up the X-axis
y sin 2 ( x p/4 ) 1
- mark the initial point on the x-axis, (-p/4)
- slide to cycle's end p units right (-p/4 p
3p/4)
7
Step 2 chop it in 4
y sin 2 ( x p/4 ) 1
- find the mid point of the interval
- find the mid points of the two intervals
8
Step 3Slide it up or down
y 1 sin 2 ( x p/4 ) 1
parameters a and k are the vertical sliders
- vertical translation k -1
- slide the x-axis down 1 unit
- amplitude a 1
- curve rises 1 unit to max
- curve falls 1 unit to min
- max k a 0, min k - a -2,
9
Step 3 Slide it up or downSetting up the Y- axis
y 1 sin 2 ( x p/4 ) 1
p / 4
p / 2
3 p / 4
- p / 4
0
- slide the x-axis down to y -1
- mark the max at (0, 0),
- the min at (p / 2, - 2)
- mark the 3 points where the curve is "on axis".
10
Step 4Sketch the Curve
y sin 2 ( x p/4 ) 1
p / 4
p / 2
3 p / 4
- p / 4
- since a gt 0, the curve rises to maximum (0, 0)
- then moves back to the horizontal axis y -1
- then down to min at (p/2, -2)
- then moves back to the horizontal axis y -1
- Click your mouse for the summary
11
Graphing a Sine Curve summary
- on the x-axis, find " h " cycle's initial point.
- on the x-axis find cycle's end point (2p / b)
h. - chop that interval into 4 equal parts.
- slide the horizontal axis up or down k units.on
axis are cycle's initial, mid and end points.
min k a, max k a, plot them . - sketch away.
Recommended
