
Alternative Methods for Assigning Overhead Costs PowerPoint PPT Presentation
1 / 21
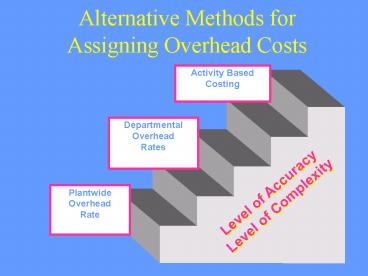
Title: Alternative Methods for Assigning Overhead Costs
1
Alternative Methods for Assigning Overhead Costs
Activity Based Costing
Departmental Overhead Rates
Level of Accuracy Level of Complexity
Plantwide Overhead Rate
2
Symptoms of an outdated cost system.
- The outcome of bids is difficult to explain.
- Competitor's prices appear unrealistically low.
- Operational managers want to drop products that
appear profitable. - Profit margins are hard to explain.
- The company has a highly profitable niche all
to itself. - Customers do not complain about price increases.
- Some departments are using their own accounting
system.
3
Traditional cost systems
- Departmental or plant-wide OH rates.
- Tend to rely on unit-level cost drivers.
- Most common is direct labor hours.
- Assigns more cost to high-volume products.
- Ignores other factors such as design complexity
and product diversity. - As a result, complex low-volume products are
likely to be subsidized by high-volume products.
4
Consider the following two restaurants.
- One does a high-volume lunch business by limiting
the menu to a salad/soup bar and choice of five
sandwiches. - The second serves fewer customers, but has
excellent service and a wide menu selection. - The restaraunts are similar in size and are
located in the same area. - Which restaraunt is likely to be more costly to
operate? Why?
5
ABC/ABM
- Activities are the root cause of costs.
- Not all activities relate simply to the number of
units produced. - Need both unit and non-unit level cost drivers.
- Products/customers consume the activities.
- Get more accurate info by assigning cost based on
activities required (ABC). - To manage cost, we must reduce the consumption of
the costly activities (ABM).
6
Coopers Hierarchy of Activities
Activities performed to sustain the
organizations existence.
Facility sustaining
Activities performed to develop or support
product lines, but not specific units or batches.
Product sustaining
Activities performed for a group of
units/customers.
Batch level
Activities performed for each individual
unit/customer.
Unit level
7
Restaurant example continued
- Can you think of activities performed
- For each customer (unit)?
- For groups of customers (batch)?
- To develop/support menu items (product)?
- To maintain the restaurant (facility)?
8
Classify the following activities as unit, batch,
product or facility and suggest an appropriate
cost driver.
- Receiving raw material for production.
- Setting up production equipment.
- Machining the product.
- Assembling the product.
- Inspecting the product for quality.
- Shipping the product.
- Advertising the product.
- Maintaining equipment.
- Recording plant depreciation.
9
Steps for Activity Based Costing (ABC)
- 1. Identify the activities.
- 2. Combine activities into homogenous
- cost pools.
- 3. Select activity (cost) driver for each
- pool and calculate the activity rate.
- 4. Assign cost to products using activity
- rates or consumption ratios.
10
Activity Identification
Activity Inventory What activities are
performed?
1. Develop test programs 2. Make probe cards 3.
Test products 4. Set-up lots 5. Collect
engineering data 6. Move water lots 7. Insert
dies 8. Provide utilities 9. Provide space 10.
Purchase materials 11. Receive materials 12. Pay
for materials
Could be 200-300 activities, depending on the
size of the firm.
Where does this information come from?
11
Form Homogenous Cost Pools
Overhead Cost
Activity pool 3
Activity pool 1
Activity pool 2
Why do we need to combine activities into
pools? How many cost pools do we need? When can
you combine activities together?
12
Select an Activity Driver for Each Pool and
Calculate an Activity Rate
Overhead Cost
Activity pool 1 Setups
Activity pool 2 Machine hours
Activity pool 3 Engineering changes
Activity Cost of the Activity Rate
Activity Driver
Ex. 100,000 in pool 1 for 100 total set-ups.
13
Assign Overhead Cost to Products Using
Activity Rates or Consumption Ratios
Overhead Cost
Activity pool 1 Setups
Activity pool 2 machine hours
Activity pool 3 Engineering changes
Product A
Product B
Product B requires 40
setups.
Product A requires 60 setups.
14
A Traditional Costing Example
- Total overhead costs of 775,000 are currently
applied to product lines on the basis of direct
labor hours.
Product
Product Product
Line 1 Line 2 Line 3
Units produced 100,000 200,000
150,000 Direct labor hours
2,000 3,500
2,250 Total Overhead Cost
? ?
? Overhead Cost Per Unit ?
? ?
Calculate the overhead cost per unit.
15
Unit Overhead Cost Using Plantwide Rate
Predetermined Overhead Rate 775,000/7,750
direct labor hours
100 per direct labor hour
Unit Cost Using Plantwide Rate
Unit Cost Product Line 1 (2,000 dlh x 100)
200,000/100,000
2.00 Unit Cost Product Line 2 (3,500 dlh x
100) 350,000/200,000
1.75 Unit Cost Product Line 3 (2,250 dlh x
100) 225,000/150,000
1.50
16
An ABC Example
An ABC study revealed that the following
activities as the underlying cause of overhead
costs. 1. Writing Test Programs for Products
200,000 2. Making Circuit Boards (with
machines) 120,000 3. Setting-up Machines
175,000 4. Inserting Components
100,000 5. Providing Space
50,000 6. Utility Cost
130,000
Total Overhead 775,000
Are these unit, batch, product or facility level
activities?
17
An ABC Example (Continued)
Product
Product Product Operational Data Line
1 Line 2 Line 3 Units produced
100,000 200,000
150,000 Number of batches 200
300 600
Machine hours 5,000
6,000 4,000 Number of
products 150
50 200 Square feet of space
5,000 7,000
6,000 Direct labor hours
2,000 3,500 2,250
How many cost pools do we need? Select a
driver for each pool.
18
Forming Cost Pools and Selecting Drivers
775,000
Writing Prog. Making /Ins.
Setups
Space/Util. 200,000 220,000
175,000
180,000
Products Machine hours
Batches Square feet
Activity Drivers
Product Product
Product Line 1
Line 2 Line 3
19
Calculating Activity Rates for Each Cost Pool
Cost Driver Activity
Activity Pool Level Amount
Driver Rate
Writing Prog. Products 200,000 400
products 500 product Making/Ins. Units
220,000 15,000 M. H.
14.67/M. H. Setup Batch
175,000 1,100 batches
159.09/batch Space/Util. Facility
180,000 18,000 sq.. feet 10/sq. foot
20
Assigning Cost to Product Lines
Cost Product Product
Product Pool Line 1
Line 2 Line 3 Total
Writing Prog. 75,000 25,000
100,000 200,000 Making/Ins. 73,350
88,020 58,630
220,000 Setup 31,818
47,727 95,455 175,000 Space/Util.
50,000 70,000
60,000 180,000 Total
230,168 230,747 314,085
775,000
Unit Cost Product Line 1 230,168/100,000 units
2.30/unit Unit Cost Product Line 2
230,747/200,000 units 1.15/unit Unit Cost
Product Line 3 314,085/150,000 units
2.09/unit
21
Comparison of ABC and Conventional Costing
Unit Cost ABC Unit Cost Plantwide
Product Line 1 2.30
2.00 Product Line 2 1.15
1.75 Product Line 3
2.09 1.50
Rule-of-thumb Conventional cost systems
tend to over-cost high
volume products and under-cost low volume
items. (Please note
implications for product line 2.)
Recommended
