
MAP and IMPROVE II Experimental Areas PowerPoint PPT Presentation
Title: MAP and IMPROVE II Experimental Areas
1
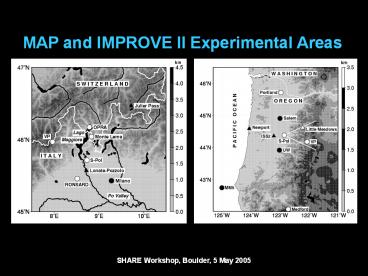
MAP and IMPROVE II Experimental Areas
SHARE Workshop, Boulder, 5 May 2005
2
2D Idealized WRF simulation of cross-barrier flow
3
MAP IOP2b 20 September 1999
3h MEAN S-Pol RADAR DATA
STABILITY FROM MILAN SOUNDING
1 2 3 4 5 6
REFLECTIVITY
1 2 3 4 5 6
RADIAL VELOCITY
VERTICAL POINTING RADAR
Height (km)
REFLECTIVITY
FREQUENCY OCCURRENCE
1 2 3 4 5 6
Dry snow (50 ) Wet snow (30 ) Graupel - Shaded
RADIAL VELOCITY
120 90 60 30 0
Distance (km) from S-Pol radar
4
MAP IOP2b 20 September 1999
3h MEAN S-Pol RADAR DATA
STABILITY FROM MILAN SOUNDING
1 2 3 4 5 6
REFLECTIVITY
1 2 3 4 5 6
RADIAL VELOCITY
VERTICAL POINTING RADAR
Height (km)
REFLECTIVITY
FREQUENCY OCCURRENCE
1 2 3 4 5 6
Dry snow (50 ) Wet snow (30 ) Graupel - Shaded
RADIAL VELOCITY
120 90 60 30 0
Distance (km) from S-Pol radar
5
MAP IOP8 21 October 1999
3h MEAN S-Pol RADAR DATA
STABILITY FROM MILAN SOUNDING
1 2 3 4 5 6
REFLECTIVITY
1 2 3 4 5 6
RADIAL VELOCITY
VERTICAL POINTING RADAR
Height (km)
REFLECTIVITY
REFLECTIVITY
FREQUENCY OCCURRENCE
1 2 3 4 5 6
Dry snow (50 ) Wet snow (30 ) Graupel - Shaded
RADIAL VELOCITY
RADIAL VELOCITY
Graupel and/or dry aggregates Shaded
120 90 60 30 0
0600 0800 1000 1200
Distance (km) from S-Pol radar
Time (UTC) 21 Oct
6
2D Idealized WRF simulation of cross-barrier
flow CASE 11
7
IMPROVE II CASE 11 13-14 December 2001
3h MEAN S-Pol RADAR DATA
STABILITY FROM UW SOUNDING
1 2 3 4 5 6
REFLECTIVITY
1 2 3 4 5 6
RADIAL VELOCITY
VERTICAL POINTING RADAR
Height (km)
REFLECTIVITY (dBZ)
1 2 3 4 5 6
FREQUENCY OCCURRENCE
RADIAL VELOCITY (m/s)
Dry snow (50 ) Wet snow (30 ) Graupel - Shaded
Graupel and/or dry aggregates Shaded
2300 0000 0100 0200
0 25 50 75 100
Time (UTC) 13-14 Dec
Distance (km) from S-Pol radar
8
IMPROVE II CASE 11 13-14 December 2001
Ice particle images obtained by NOAA P3
9
IMPROVE II CASE 11 13-14 December
2001 Idealization
10
JAMES AND HOUZE 05 Synoptic Situations
11
JAMES AND HOUZE 05 Radar Climatology
12
What to investigate in SHARE?Processes
affecting precipitation enhancement over windward
slope
- More stable cases
- Enhancement of low-level shear over windward
slope in stable case - Turbulence in shear layer over the windward slope
- Buoyancy, shear, terrain
- How turbulent overturning layer affects
microphysical processes - Aggregation, riming, coalescence
- Temperature feedback
- Less stable cases
- Enhanced lifting over small-scale individual
peaks vs barrier scale - Stable lifting at high Fr, or release of
potential instability - Microphysical processes over individual peaks
- Riming, aggregation, coalescence
13
End
14
IMPROVE II CASE 11 13-14 December 2001
NOAA P3 aircraft tail radar data
15
IMPROVE II CASE 11 13-14 December 2001
Upstream sounding used in simulation
16
Upstream-upslope rain gauge comparison
TOTALS Salem 10.24 Little Meadows 30.50
Recommended
