
What is the equation of this graph? {applet} PowerPoint PPT Presentation
1 / 2
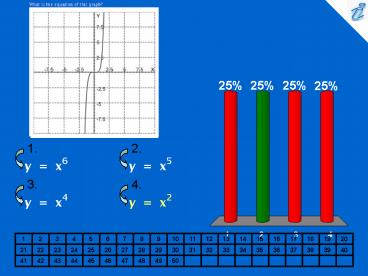
Title: What is the equation of this graph? {applet}
1
What is the equation of this graph? applet
- image
- image
- image
- image
1 2 3 4 5 6 7 8 9 10 11 12 13 14 15 16 17 18 19 20
21 22 23 24 25 26 27 28 29 30 31 32 33 34 35 36 37 38 39 40
41 42 43 44 45 46 47 48 49 50
2
The table shows (lifetime) peptic ulcer rates
(per 100 population) for various family incomes
as reported by the 1989 National Health Interview
Survey. Find a slope of linear model using the
first and last data points. Number Ulcer
rate of data point (per 100
population) Income
First 14.1 3,000 Second
13.6 5,000 Third 13.9 7,000
Fourth 13.1 13,000 Fifth
12.1 19,000 Choose the answer from the
following
- -0.000125
- -0.00025
- -0.0001
1 2 3 4 5 6 7 8 9 10 11 12 13 14 15 16 17 18 19 20
21 22 23 24 25 26 27 28 29 30 31 32 33 34 35 36 37 38 39 40
41 42 43 44 45 46 47 48 49 50
Recommended
