
LIDAR Data Visualization PowerPoint PPT Presentation
Title: LIDAR Data Visualization
1
LIDAR Data Visualization
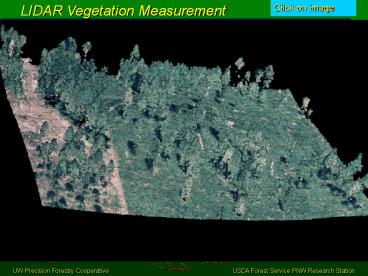
LIDAR Vegetation Measurement
Click on image
- Raw LIDAR point cloud, Capitol Forest, WA
- LIDAR points colored by orthophotograph
2
Canopy fuels measurement with LIDAR and IFSAR
- Hans-Erik Andersen
- Gerard Schreuder
- James Agee
- Precision Forestry Cooperative
- University of Washington, Seattle
- Steve Reutebuch, Bob McGaughey, Ward Carson
- USDA Forest Service
- PNW Research Station
- Silviculture and Forest Models Team
- Seattle, Washington
3
Canopy fuel mapping using active remote sensing
technologies
- Airborne laser scanning (LIDAR)
- Interferometric synthetic aperture radar (IFSAR)
- High resolution in 0.1 -- 5 m range both vert.
horizontal - Direct measurement of 3-D structure
- Forest vegetation terrain
- Spatially-explicit data for input to fire
behavior models - FARSITE, BEHAVE, etc.
- GIS coverages
4
Objectives of JFSP project
- LIDAR and IFSAR for estimation and mapping of
canopy fuels - Canopy cover
- Canopy height
- Canopy base height
- Canopy bulk density
- Canopy fuel weight
- Comparison to field estimates at plot-level
- Technology transfer
- Publications, workshops, seminars
- Data processing software
5
Study Sites
- Capitol State Forest, Western Washington
- (Washington State DNR)
- Fort Lewis Military Reservation, Western
Washington - (US Army, DOD)
- Mission Creek FFS site, Eastern Washington
6
Airborne Laser Mapping LIDAR (LIght Detection
And Ranging)
- 5,000 80,000 laser pulses / sec
- Captures multiple (2-5) reflections per laser
pulse - Point density 1 20 pts. / sq. m.
- Laser reflections produce a large cloud of XYZ
points
7
LIDAR Terrain Mapping in Forests
8
(No Transcript)
9
Canopy Surface Model
Minus
Terrain Surface Model
10
LIDAR Vegetation Height Model (LIDAR Canopy
minus LIDAR Ground DEM)
Canopy Height (m)
11
LIDAR data visualization
Click on image
12
LIDAR Data Visualization
Click on image
- Raw LIDAR point cloud, Capitol Forest, WA
- LIDAR points colored by orthophotograph
- FUSION visualization software developed for point
cloud display measurement
13
LIDAR-based Canopy Cover Estimation
Canopy Cover Canopy hits / Total hits 13
/ 20 65
14
LIDAR-based Canopy Cover Estimation
Orthophoto
15
Plot-level LIDAR canopy fuel measurement
- Plot-level LIDAR metrics can be used to estimate
canopy fuel parameters - Canopy height
- Canopy base height
- Canopy bulk density
- Canopy fuel weight
- Field-based canopy fuel estimates generated using
Scott and Reinhardt approach (2001)
16
Plot-level LIDAR canopy fuel measurement
- 135 plots established at Capitol Forest across
range of stand ages - Plot-level canopy fuel variables estimated using
regression models
17
Plot-level LIDAR canopy fuel measurement
Click on image
- Distribution of LIDAR point data within 1/5 ac.
plot
18
Plot-level LIDAR canopy fuel measurement
Click on image
- Distribution of crown fuel models within plot
19
Plot-level LIDAR canopy fuel measurement
Click on image
- Distribution of crown fuel models LIDAR data
within plot
20
Plot-level LIDAR Canopy Height
- (R 2 0.98)
- LIDAR-derived (x) vs. field (y)
Line shows 11 relationship
21
LIDAR Canopy Height GIS Layer
(30 m pixels)
22
Plot-level LIDAR Canopy Base Height
- (R 2 0.87)
23
LIDAR Canopy Base Height GIS Layer
24
Plot-level LIDAR Canopy Bulk Density
- (R 2 0.85)
25
LIDAR Canopy Bulk Density GIS Layer
26
Plot-level LIDAR Canopy Fuel Weight
- (R 2 0.87)
27
LIDAR Canopy Fuel Weight GIS Layer
28
IFSAR Technology Overview(Interferometric
Synthetic Aperture Radar)
- Microwave sensor
- Multiple frequencies polarities
- X-band (canopy)
- P-band (terrain)
29
IFSAR Technology Overview
- Up to 10,000 sq km per hour data collection
rate! - Lower resolution than LIDAR (0.25-2m)
- Costs for data much lower than LIDAR
- IFSAR data characterizes
- Terrain surface
- Vegetation canopy structure
- Biomass fuels
30
IFSAR Data Visualization
X-band canopy measurements (color coded by
height)
P-band ground surface (gray)
Orthophoto
31
IFSAR backscatter image
X-band radar reflectance image, Capitol Forest
32
IFSAR Canopy Height Model
Orthophoto
IFSAR Data
33
Plot-level IFSAR canopy fuel measurement
- Plot-level IFSAR metrics can be used to estimate
canopy fuel parameters - Canopy height
- Canopy base height
- Canopy bulk density
- Canopy fuel weight
- All measures are hi-res, geospatial data at
landscape-level ? GIS layers of fuel variables
34
Plot-level IFSAR canopy fuel measurement
Click on image
- Crown fuel models IFSAR elevations within plot
35
Plot-level IFSAR Canopy Height
- (R 2 0.88)
36
Plot-level IFSAR Canopy Base Height
- (R 2 0.87)
37
Plot-level IFSAR Canopy Bulk Density
- (R 2 0.78)
38
Plot-level IFSAR Canopy Fuel Weight
- (R 2 0.80)
39
Conclusions (to date)
- LIDAR and IFSAR provide accurate measurement of
- Terrain
- Fuel variables
- Canopy cover
- Canopy height
- Canopy base height
- Canopy bulk density weight
- LIDAR
- High resolution measurements (lt 1 m)
- 1 2 per acre
- IFSAR
- Very high collection rate ( 10,000 sq km per
hour) - Lower resolution than LIDAR (1-2 m)
- Lower cost ( 0.15 per acre)
40
Products and Technology Transfer
- Papers (8)
- Conference presentations (7)
- PhD dissertation (1)
- Seminars and workshops
- USFS Forest Inventory and Analysis team,
Portland, OR (1/04) - USFS Forestry Sciences lab, Olympia, WA (3/04)
- Fort Lewis Forestry Department (3/04)
- Stand Management Cooperative meeting, (4/04)
- USFS Forestry Sciences lab, Moscow, ID (planned
5/04) - Website
41
Project timeframe
- LIDAR and IFSAR data collection completed at
westside sites (Capitol Forest, Fort Lewis) - 1-yr delay at Mission Creek FFS site due to
delays in prescribed burns - Project complete by summer, 2005
- 1-yr no-cost extension requested
42
Thank You !!!
Click on image
43
Future JFSP-funded IFSAR research on 2003 SoCal
Fires
- Mapping of pre-fire fuels loading
- and burn intensity using
- pre-fire SoCal IFSAR data-set and
- post-fire multispectral imagery
- JFSP-funded
- 10 million acres of WUI
- Covers all 5 major fires in pre-fire condition
- Also hi-res multispectral, post-fire imagery
available for fires - Multiple collaborators
- Public domain data
Recommended
