
Toxicity Testing contd PowerPoint PPT Presentation
1 / 31
Title: Toxicity Testing contd
1
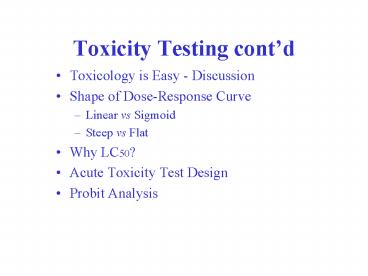
Toxicity Testing contd
- Toxicology is Easy - Discussion
- Shape of Dose-Response Curve
- Linear vs Sigmoid
- Steep vs Flat
- Why LC50?
- Acute Toxicity Test Design
- Probit Analysis
2
Shape of the Dose-Response Relationship
3
Why LC50?
100
Response
0
Low
High
Concentration (or Dose)
4
Acute Toxicity Test Design
- Test Material (toxicant)
- Pure
- Commercial formulation
- Mixtures of known concentration
- Carriers/solvents
- Unknown mixtures (eg. sediment,effluent)
5
- 2. Test Organism
- Most sensitive
- Most representative
- Wild species
- Rear in lab
- Known physiology
- Bred for uniformity
- Certified disease free
- Known susceptible strain
Ex Daphnia Fathead minnows Rats/Mice Animal
Cell cultures Algal cell cultures Duckweed Meal
worms Earthworms Frogs/tadpoles
6
- 3. Exposure Method/Apparatus
- Oral dose/gavage
- Diet
- Intraperitoneal injection
- Inhalant
- Dermal
- Dry vial
- Static vs Flow-thru aquaria
7
- 4. Experimental Design
- Sample size
- Unbiased allocation of subjects
- Test environment (temp, 02, pH, light cycle,
food, etc) - Negative controls (untreated, solvent/carrier)
- Positive controls (toxin with well known effect)
- Baseline measurements (size, test envt, etc)
8
- 5. Range-Finding Test
- 10X progression of toxin concentration
- 3-5 individuals per concentration
- 5 concentrations plus control(s)
9
- 6. Definitive Test
- Expand on meaningful conc. From range test
- 5 conc. Plus control(s)
- Geometric progression of conc. (2X or higher)
- 1 conc. Kills lt 35 1 conc. Kills gt 65
- 10 individuals per concentration
- Replicates?
- 96h, no food
10
- 7. Endpoint (what response to measure?)
- Death (LC50, LD50)
- Paralysis, loss of equilibrium (EC50)
- Other sub-lethal endpoints (EC50)
Pop. growth rate Indiv. growth rate Foraging
behavior Escape behavior Learning/cognitive
Bone formation Protein production Enzyme
activity Chromosome breakage RNA synthesis
11
8. Calculations
- Plot mortality vs log conc. (or dose)
- Do not include control data in curve fit
- If control mortality exceeds 10, correct w/
Abbotts formula - Do probit analysis for accurate LC50
- Calc. 95 confidence intervals
12
(Lindane)
Diff. toxicity to diff. spp. Diff. Toxicity via
diff routes of exposure why?
13
Yikes! those are my tax dollars!
What about transgenerational effects??
14
Scale of Toxicological Endpoints
Increasing reality Increasing cost Increasing
uncertainty
15
Probit Analysis
- Turn a curve into a line
- Can connect dots more accurately
- Allows accurate inverse prediction
- Allows statistical analysis using
regression/linear models - Probit probability unit
- of population responding as a function of
standard deviation units from the mean
16
Tolerance
No. of Individuals
No. of Individuals
Log of Concentration
Concentration
Dose-Response
Cumulative Percent
Cumulative Percent
Concentration
Log of Concentration
17
Result nearly straight line
18
50
Normal Distribution
Mean
Std Dev Units
1. What of observations fall with each SD unit?
2. Express from above as cumulative percent.
3. Assign probits to cumulative .
19
50
Normal Distribution
Mean
Std Dev Units
1. What of observations fall with each SD unit?
2.5
2.5
34.2
34.2
13.3
13.3
2. Express from above as cumulative percent.
3. Assign probits to cumulative .
20
50
Normal Distribution
Mean
Std Dev Units
1. What of observations fall with each SD unit?
2.5
2.5
34.2
34.2
13.3
13.3
2. Express from above as cumulative percent.
15.8
84.2
97.5
2.5
3. Assign probits to cumulative .
21
50
Normal Distribution
Mean
Std Dev Units
1. What of observations fall with each SD unit?
2.5
2.5
34.2
34.2
13.3
13.3
2. Express from above as cumulative percent.
15.8
84.2
97.5
2.5
2.5
3. Assign probits to cumulative .
2.5
15.8
84.2
97.5
22
Log
Probit
6.18
1.009
6.18
1.009
23
Inverse Prediction
Log LC84 0.93 LC84 8.51 Log LC16 0.43 LC16
2.69 Log LC50 0.68 LC50 4.79
Why calc. 95 C.L.? How?
24
Calculating 95 Confidence Limits of
LC50's (source F. Matsumura. 1985. Toxicology of
Insecticides, 2nd Ed., Plenum, pp.14-16) Example
Worksheet - Rotenone toxicity to Macrosphoniella
sanborni 1. Use inverse prediction from the
graph to estimate the Log 10 of the LC84, LC16,
and LC50 then un-log the values and express as
mg/L. Log10 Conc. Conc.(mg/L) eg LC84
LC16 LC50 2. Calculate S and Log10 (S)
(use the 'un-logged' dose/conc. values). LC84
LC50 S LC50 __ LC16
2 S Log10 (S)
25
Calculating 95 Confidence Limits of
LC50's (source F. Matsumura. 1985. Toxicology of
Insecticides, 2nd Ed., Plenum, pp.14-16) Example
Worksheet - Rotenone toxicity to Macrosphoniella
sanborni 1. Use inverse prediction from the
graph to estimate the Log 10 of the LC84, LC16,
and LC50 then un-log the values and express as
mg/L. Log10 Conc. Conc. (mg/L) eg LC84
.93 8.51 LC16 .43 2.69 LC50
.68 4.79 2. Calculate S and Log10 (S) (use
the 'un-logged' dose/conc. values). LC84
LC50 8.51 4.79 S LC50 __ LC16
4.79 2.69 2
2 S 1.78 Log10 (S) 0.250
26
3. Determine N N the total number of
individuals tested between the range of dosages
that correspond to the LC16 to the LC84. N
4. Calculate Log10(f) and f.
2.77 Log10(f) ? N x Log10
(S) Log10(f) f
5. Calculate Upper and Lower 95 Confidence
Limits (multiply or divide 'unlogged' conc/dose
values by f) Upper Limit LC50 x f
Lower Limit LC50 / f
27
3. Determine N N the total number of
individuals tested between the range of dosages
that correspond to the LC16 to the LC84. N
49 46 48 143 4. Calculate Log10(f) and
f. 2.77 Log10(f)
? N x Log10 (S) Log10(f) f 5.
Calculate Upper and Lower 95 Confidence Limits
(multiply or divide 'unlogged' conc/dose values
by f) Upper Limit LC50 x f
Lower Limit LC50 / f
28
3. Determine N N the total number of
individuals tested between the range of dosages
that correspond to the LC16 to the LC84. N
49 46 48 143 4. Calculate Log10(f) and
f. 2.77
2.77 Log10(f) ? N x Log10 (S) ? 143
x 0.250 Log10(f) 0.058 f
1.143 5. Calculate Upper and Lower 95
Confidence Limits (multiply or divide
'unlogged' conc/dose values by f) Upper
Limit LC50 x f Lower Limit LC50 /
f
29
3. Determine N N the total number of
individuals tested between the range of dosages
that correspond to the LC16 to the LC84. N
49 46 48 143 4. Calculate Log10(f) and
f. 2.77
2.77 Log10(f) ? N x Log10 (S) ? 143
x 0.250 Log10(f) 0.058 f
1.143 5. Calculate Upper and Lower 95
Confidence Limits (multiply or divide
'unlogged' conc/dose values by f) Upper
Limit LC50 x f 4.79 x 1.143
5.47 Lower Limit LC50 / f 4.79 /
1.143 4.19
LC50 4.79 mg/L (4.19 5.47 95 C.L.)
30
(No Transcript)
31
Log scale
Recommended
