
Oregon Benchmark Data for: Marion, Polk and Yamhill Counties - PowerPoint PPT Presentation
1 / 53
Title:
Oregon Benchmark Data for: Marion, Polk and Yamhill Counties
Description:
Affordable Housing - R. 19. 17. 32. 73. Home Ownership. 26. 31. 28. 66. ... Percent of babies whose mothers received prenatal care beginning in ... US ... – PowerPoint PPT presentation
Number of Views:91
Avg rating:3.0/5.0
Title: Oregon Benchmark Data for: Marion, Polk and Yamhill Counties
1
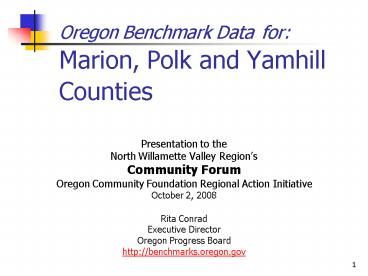
Oregon Benchmark Data forMarion, Polk and
Yamhill Counties
- Presentation to the
- North Willamette Valley Regions
- Community Forum
- Oregon Community Foundation Regional Action
Initiative - October 2, 2008
- Rita Conrad
- Executive Director
- Oregon Progress Board
- http//benchmarks.oregon.gov
2
What are Oregon Benchmarks?
- 91 statewide yardsticks of progress toward three
statewide goals - Quality jobs for all Oregonians
- Engaged, caring safe communities
- Healthy, sustainable surroundings
- 31 have county data.
- County tools andproducts at
www.oregon.gov/DAS/OPB
3
First, some basic demographics
4
A Century of population growth 1900-2000
Sources U.S. Census Bureau
Office of Economic Analysis
5
Population size 2007
Source Portland State University Population
Research Center (Certified Estimates)
6
Percent of Hispanic Minority populations, 2007
Office of Economic Analysis
Source U.S. Census Bureau
7
Change in Hispanic Minority populations,
2000-06
Office of Economic Analysis
Source U.S. Census Bureau
8
Percent of population with household incomes
below 100 of the federal poverty level
Related to Oregon Benchmark 54
15 of Marion County lives below poverty. Marion
27thPolk 7thYamhill 6th
Sources U.S. Census Bureau, Small Area Income
Poverty Estimates
9
Overview of benchmark rankings
Economy
Kids
Education
Crime
Kids
Poverty
10
In the interest of time and prevention
- The focus of this presentation will be on
children and youth. - Your handouts have more complete benchmark data.
- For even more, go to http//benchmarks.oregon.gov
11
Percent of children entering school ready to learn
Related to Oregon Benchmark 18
About one in five kindergarteners enter school
with learning challenges. Marion 16thPolk
29thYamhill 31th
Source Oregon Department of Education,
Kindergarten Surveys
12
Percent of 3rd grade students who achieve
established skills in reading
Related to Oregon Benchmark 19a
One in five Marion County 3rd graders do not read
at grade level. Marion 36th Polk 27th
Yamhill 24th
Source Oregon Department of Education, Oregon
Statewide Assessment
13
Percent of 3rd grade students who achieve
established skills in math
Related to Oregon Benchmark 19b
More than one in five Marion County 3rd graders
lack grade-level math skills. Marion 35th
Polk 20th Yamhill 10th
Source Oregon Department of Education, Oregon
Statewide Assessment
14
Percent of 8th grade students who achieve
established skills in reading
Related to Oregon Benchmark 20a
Over 40 of Marion County 8th graders lack
grade-level reading skills. Marion 33rd
Polk 19th Yamhill 15th
Source Oregon Department of Education, Oregon
Statewide Assessment
15
Percent of 8th grade students who achieve
established skills in math
Related to Oregon Benchmark 20b
Over 40 of Marion County 8th graders lack
grade-level math skills. Marion 30th Polk
21st Yamhill 15th
Source Oregon Department of Education, Oregon
Statewide Assessment
16
Pregnancy rate per 1,000 females ages 15-17
Related to Oregon Benchmark 39
Marion Countys teen pregnancy rate is once again
approaching 40 percent.
Marion 33rd Polk 22nd Yamhill 19th
Source Oregon DHS, Center for Health
Statistics, Oregon Vital Statistics Annual
Report. Population estimates by Portland State
University Population Research Center
17
Percent of babies whose mothers received prenatal
care beginning in the first trimester
Related to Oregon Benchmark 40
One in four Marion County babies lack adequate
prenatal care. Marion 31st Polk 24th
Yamhill 16th
Source Oregon Department of Human Services,
Center for Health Statistics, Oregon Vital
Statistics Annual Report
18
Percent of two-year-olds who are adequately
immunized
Related to Oregon Benchmark 42
One in four two-year-olds are not getting
adequately immunized. Marion 28th Polk 25th
Yamhill 22nd
Source Oregon Department of Human Services,
Immunizations Program, ALERT registry
19
Number of child care slots available for every
100 children under age 13
Related to Oregon Benchmark 48
Child care is a problem. The benchmark target
is 25. Marion, Polk and Yamhill are all under
14. Marion 28th Polk 25th Yamhill 22nd
Source Child Care Research Partnership and
Oregon Employment Department, Child Care Division
20
Number of children who are abused or neglected or
are at risk of abuse or neglect (per 1,000)
Related to Oregon Benchmark 51a
Marion 25th Polk 18th Yamhill 9th
One in 50 children are abused in Marion County.
Source Oregon Department of Human Services, CAF
Program Performance and Reporting Research Unit
21
If we have time
22
Percent of 8th grade students who report using
alcohol in the previous 30 days
Related to Oregon Benchmark 50a
Nearly one in three Marion County 8th graders
drink alcohol. Marion 15th Polk 5th
Yamhill 13nd
Source 1990-2000 Oregon Public Schools Drug
Use Survey, for Office of Alcohol and Drug Abuse
Programs 2001 forward Oregon Healthy Teens
Survey, by Oregon Office of Mental Health
Addiction Services and DHS Center for Health
Statistics
23
Percent of 8th grade students who report using
illicit drugs in the previous 30 days
Related to Oregon Benchmark 50b
8th grade drug use appears to be on the
decline. Marion 13th Polk 10th Yamhill
9nd
Source 1990-2000 Oregon Public Schools Drug
Use Survey, for Office of Alcohol and Drug Abuse
Programs 2001 forward Oregon Healthy Teens
Survey, by Oregon Office of Mental Health
Addiction Services and DHS Center for Health
Statistics
24
Percent of 8th grade students who report using
cigarettes in the previous 30 days
Related to Oregon Benchmark 50c
8th grade smoking appears to be on the
decline. Marion 18th Polk 21th Yamhill
25nd
Source 1990-2000 Oregon Public Schools Drug
Use Survey, for Office of Alcohol and Drug Abuse
Programs 2001 forward Oregon Healthy Teens
Survey, by Oregon Office of Mental Health
Addiction Services and DHS Center for Health
Statistics
25
Percent of infants whose mothers used alcohol
during pregnancy (self-reported)
Related to Oregon Benchmark 53a
Source Oregon DHS, Health Services Cluster,
Center for Health Statistics, Oregon Vital
Statistics Annual Report
26
Percent of infants whose mothers used tobacco
during pregnancy (self-reported)
Related to Oregon Benchmark 53b
Source Oregon Department of Human Services,
Center for Health Statistics, Oregon Vital
Statistics Annual Report
27
Juvenile arrests for crimes against persons per
1,000 juveniles per year
Related to Oregon Benchmark 63a
Murder, negligent homicide, forcible rape, other
sex crimes, kidnapping, robbery, aggravated
assault and simple assault
Source Oregon State Police, Uniform Crime
Reporting Program. Population estimates are
provided either by official census or estimates
by Portland State University, Population Research
Center
28
Juvenile arrests for property crimes per 1,000
juveniles per year
Related to Oregon Benchmark 63b
Burglary, larceny/theft, motor vehicle theft,
arson, forgery/counterfeit, fraud, embezzlement,
stolen property, and vandalism
Source Oregon State Police, Uniform Crime
Reporting Program. Population estimates are
provided either by official census or estimates
by Portland State University, Population Research
Center
29
JUVENILE RECIDIVISMPercent of juveniles with a
new criminal referral to a county juvenile
department within 12 months of the initial
criminal offense
Related to Oregon Benchmark 66
Source Oregon Youth Authority
30
Still more county benchmarks reference slides
31
Net job growth (loss) per 1,000 population
Related to Oregon Benchmark 4
Source Covered Employment and Payrolls, Oregon
Employment Department
32
Concentration in professional services relative
to the U.S. (U.S.100)
Related to Oregon Benchmark 5
Source Oregon Employment Department and the
U.S. Bureau of Labor Statistics
33
Per capita personal income as percent of the U.S.
per capita income
Related to Oregon Benchmark 11
Source Oregon Employment Department
34
Average annual payroll per covered worker (all
industries, 2006 dollars)
Related to Oregon Benchmark 12
Source Oregon Employment Department. Figures
are converted to 2006 dollars using the U.S.
Implicit Price Deflator for Personal Consumption
Expenditures
35
Annual unemployment rate
Related to Oregon Benchmark 15a
Source Oregon Employment Department
36
Unemployment rate as a percent of U.S.
unemployment rate
Related to Oregon Benchmark 15b
Source Oregon Employment Department
37
High school dropout rate (grades 9-12 for the
listed school year)
Related to Oregon Benchmark 22
Source Oregon Department of Education, Early
Leaver Fall Report
38
Percent of Oregon adults who have completed high
school (or GED) or more
Related to Oregon Benchmark 23
Source US Census Bureau decennial census for
1980-2000 American Community Survey 2005 on.
39
Percent of Oregon adults who have completed a
Baccalaureate degree or more
Related to Oregon Benchmark 26a
Source US Census Bureau decennial census for
1980-2000 American Community Survey 2005 on.
40
Percent of registered voters who participated in
biennial general elections
Related to Oregon Benchmark 31a
Source Oregon Secretary of State's Office,
Elections Division
41
Infant mortality rate per 1,000
Related to Oregon Benchmark 41
Source Oregon Department of Human Services,
Center for Health Statistics, Oregon Vital
Statistics Annual Report
42
New HIV infections among Oregonians, ages 13 and
older, by year of initial diagnosis a. number
Related to Oregon Benchmark 43a
Source Oregon Department of Human Services,
Office of Disease Prevention and Epidemiology,
Oregon HIV/AIDS Annual Report
43
Premature Death Years of life lost before age 70
(per 1,000 population)
Related to Oregon Benchmark 45
Source Oregon DHS, Health Services Cluster,
Center for Health Statistics, Oregon Vital
Statistics Annual Report Population Estimates for
Oregon by the Center for Population Research and
Census, School of Urban and Public Affairs, PSU
44
Percent of seniors living outside of nursing
facilities
Related to Oregon Benchmark 59
Source Oregon Department of Human Services,
Senior and Disabled Services Division
45
Overall reported crimes per 1,000 population
Related to Oregon Benchmark 62
Source Oregon State Police, Uniform Crime
Reporting Program. Population estimates are
provided either by official census or estimates
by Portland State University, Population Research
Center
46
Reported crimes against persons per 1,000
population
Related to Oregon Benchmark 62a
Source Oregon State Police, Uniform Crime
Reporting Program. Population estimates are
provided either by official census or estimates
by Portland State University, Population Research
Center
47
Reported property crimes per 1,000 population
Related to Oregon Benchmark 62b
Source Oregon State Police, Uniform Crime
Reporting Program. Population estimates are
provided either by official census or estimates
by Portland State University, Population Research
Center
48
Reported behavioral crimes per 1,000 population
Related to Oregon Benchmark 62c
Source Oregon Department of State Police,
Uniform Crime Reporting Program Population
estimates are provided either by official census
or estimates by Portland State University,
Population Research Center
49
Percent of Oregon households that are owner
occupied
Related to Oregon Benchmark 73
Source 1980 Census of Population and Housing
1990 2000 from the US Census Bureau reports
2005 onward CPS.
50
Percent of lower-income, renter households that
are cost-burdened
Related to Oregon Benchmark 74a
Source US Census Bureau
51
Percent of lower-income, owner-occupied
households that are cost-burdened
Related to Oregon Benchmark 74b
Source US Census Bureau
52
Pounds of Oregon municipal solid waste landfilled
or incinerated per capita
Related to Oregon Benchmark 84
Source Oregon Department of Environmental
Quality, Land Quality Division
53
Thank you!
- Rita Conrad, Executive DirectorRita.R.Conrad_at_stat
e.or.us 503-378-3202 - Jay Grussing, Data AnalystJay.Grussing_at_state.or.u
s 503-378-3205