
Characterization of alkanedithiol PowerPoint PPT Presentation
1 / 1
Title: Characterization of alkanedithiol
1
self-assembled monolayers ellipsometry (SE) and
TOF-DRS W. Q. Zheng2, B. Bourguignon2, M.
Canepa3, J. E. Gayone1, O. Grizzi4, V. A.
Esaulov1 Université Paris Sud 11, 91 405 Orsay,
France Via Dodecaneso 33, 16 146 Genova,
Italy 8400 S. C. de Bariloche, Río Negro,
Argentina
Characterization of alkanedithiol (SAMs) by
RAIRS, SFG, spectroscopic H. Hamoudi1, Z. Guo2,
M. Prato3, L. M. Rodríguez4, C. Dablemont1, E. A.
Sánchez4, 1 LCAM, Bât 351, and 2 LPPM, Bât.
350, 3 CNISM and Department of Physics,
University of Genova, 4 Centro Atómico Bariloche
and CONICET,
Experimental
- Introduction
- Formation of metallic nanostructures and/or
metallic thin layers on organic structures is an
important goal in the field of organic-inorganic
hybrid materials for new electronic devices. A
way to control the quality of the metal / organic
layer interface relies on self-assembled
monolayers (SAMs) of organic molecules on a
metallic surface. Indeed, SAMs are attractive
because they allow surface functionalization with
desired chemical groups (see 1 and ref
therein). For instance, an alkanedithiol SAM
functionalizes the support with thiol groups. The
pending SH group allows grafting of metallic
atoms or nanoparticles and further growth of
metallic nanostructures or thin films. Our
interest in dithiol SAMs stems specifically from
this aspect. - Numerous reports (see 2 and ref therein) on
dithiol SAMs are available in the literature.
Despite the relatively large amount of work done,
the conditions for reproducible formation of well
ordered dithiol SAMs with free standing SH
endgroups are still not well defined. It is well
known that the formation of alkanethiol SAMs
proceeds through two steps first, formation of a
so-called striped phase with the alkyl chain
lying parallel to the gold support and then
formation of the so-called standing up phase. In
the case of dithiols, formation of an initial
phase with both mercapto groups bound to the
surface may hinder the development of the
standing-up phase.
In this work the assembly of a nonanedithiol SAMs
from solution onto gold substrates is
addressed.3 The role of solvents and
preparation conditions is studied. An
experimental approach is adopted, which combines
four gentle methods able to offer insight
into several complementary aspects. Spectoscopic
Ellipsometry (SE) is used to characterise the
UV-VIS properties of the substrates and of the
interface. Further, it can be effectively
employed to get estimates of the thickness of the
deposited layers, obtaining a first insight on
the SAM organization and quality. RAIRS and SFG
are employed to provide complementary
spectroscopic data on the SAM organization and
the type of endgroup. Time Of Flight Direct
Recoil Spectroscopy (TOF-DRS) is employed to
determine the nature of the SAM-vacuum interface.
Substrate Arrandee-type Au(111) 200 nm gold
on glass flame-annealed during
3 2 min cooled under N2
washed with absolute
ethanol Solution 1 mM in absolute ethanol
(thiol, dithiol) and n-hexane (dithiol) Immersion
time between 2 min and 24 h Studied molecules
1-pentadecanethiol CH3-(CH2)14-SH C15SH
1-dodecanethiol
CH3-(CH2)11-SH C12SH
1-hexanethiol CH3-(CH2)5-SH
C6SH
1,9-nonanedithiol HS-(CH2)9-SH HSC9SH
1,5-pentanedithiol HS-(CH2)5-SH HSC5SH
Alkanedithiol spectroscopic ellipsometry The
figure compares SE measurements performed on
HSC9SH SAMs grown in n-hexane (dark blue markers,
average over 10 samples) and in ethanol (light
blue markers, average over 5 samples). Data for
C12SH SAMs are shown for comparison (red line).
Dashed lines represent the results of simulation
for total thickness of 0.5, 1.0 and 1.5 nm. The
solutions were thoroughly degassed and kept in
the dark. The small vertical error bars in the
high-wavelength region are useful to visualize
the distribution of the data related to
sample-to-sample variations. The overall shape of
?? and ?? spectra ressembles closely the data
obtained on alkanethiol SAMs.7 In particular,
the ?? curves exhibit the typical transition from
positive to negative values in correspondence
with the ?? maxima, already observed for other
thiolate interfaces. ?? patterns related to
samples grown in n-hexane show values close to
those observed on C12SH SAMs.
Alkanethiol RAIRS and SFG spectroscopies The
figure compares RAIRS and SFG of C15SH and C12SH
molecules. Presented spectra are obtained after
an immersion between 6 and 30 min in an ethanol
solution of C15SH and C12SH. In SFG the spectral
profile of the IR laser is experimentally
obtained by measuring the non resonant response
that arises from a GaAs reference sample. In the
figure we present the experimental SFG reference
spectrum (dashed black line), the experimental
SFG spectrum (solid bold black line), SFG
deconvolution (tight dashed bold red line),
adjusted SFG spectrum (dotted red line) and IR
spectrum (scattered dashed bold blue line). In
RAIRS the peak corresponding to ?as(CH2) is
located around 2917 cm-1 for long chain
alkanethiols and 2921 cm-1 for the ones with
short chain in agreement with literature for
well-organised alkanethiol SAMs.4 Indeed
?as(CH2) peak is red-shifted of at least 5 cm-1
with respect to the gas phase value. The ratio
?as(CH3) / ?s(CH3) is more important for chains
with even number of CH2 groups (case of C15SH)
because of RAIRS sensitivity to dipolar moment
interaction with the surface.
Multilayers
Taking in account the simulations, the
ellipsometric thickness of HSC9SH film grown in
n-hexane turns out to be of the order of 1 nm.
This value is compatible with a rather compact
standing-up phase SAM with tilted molecules.
Absence of SFG signal for CH2 is characteristic
of alkanethiol organisation on the surface. In
the literature it is usually explained by the
fact that contributions of CH2 in a
centrosymmetric relation is equal to zero. This
is the case in the all-trans conformation. It was
shown that in the case of an odd number of CH2
groups the orientation of the unpaired CH2 with
respect to the surface plane must also be
invoked, and gauche defect at the bottom of the
chain with an appropriate orientation may also be
compatible with the absence of CH2 in the SFG
spectrum.5 The absence of CH2 bands is
nevertheless characteristic of an ordered SAM,
most of the chain being all-trans. The important
difference seen on RAIRS between chains with even
or odd number of CH2 is also observed in SFG. It
is qualitatively understandable by the
alternative orientation of CC bonds in an
all-trans alkyl chain removing an odd number of
CH2 changes the CH3 orientation. A quantitative
analysis of these spectra is presented in ref. 6.
A closer comparison between the patterns of
dithiol SAMs grown in n-hexane and C12SH SAMs
shows some subtle difference, visible in
particular in the ?? curve in the low-wavelength
range (below 300 nm). Those differences may be
indicative of weak optical absorptions specific
of dithiol layers, with bridging S-S bonds.
Absorptions related to the presence of S-S bonds
are indeed expected in the 250-330 nm region. The
S-S bonding is thought to arise from the SAM-air
interface rather than from the Au-SAM interface
as discussed by others authors. SE measurements
on HSC9SH SAMs grown in ethanol indicate that the
layers are apparently less thick than in the
n-hexane case, probably indicating a less
compact, more disordered layer. In these
experiments, no multilayer formation is observed.
Alkanedithiol RAIRS
and SFG spectroscopies
The figure presents FT-IR transmission spectra of
C6SH (dashed red line) and HSC5SH (solid blue
line) in the gas phase.
The figure on the right compares RAIRS and SFG
spectra of HSC9SH SAMs on gold substrate. The
legend is the same as the one used for
alkanethiol. The dotted grey line indicates the
position of 2920 cm-1, which corresponds to the
?as(CH2) vibration in an organised SAM. For all
conditions, the ?as(CH2) signal intensity is of
the same order of magnitude as the one obtained
with C12SH, which is also consistent with SE data
and indicates functionalization with a monolayer
assembly. In the RAIRS spectra, no-signal at 2565
cm-1 specific of free SH is observed, which is
consistent with the weak signal observed in the
gas phase. RAIRS spectra on dithiol SAMs grown
in degassed n-hexane and with all processing done
in the dark display a peak corresponding to
?as(CH2) at 2918 cm-1. This finding is in
agreement with the value of 2919 cm-1 found by
Blanchard et al.8 for a HSC9SH SAM also
prepared in degassed n-hexane, thought lighting
conditions were not indicating. Concerning the
reproducibility of RAIRS measurements some
scatter in the position of this ?as(CH2) peak
appears in the 2918 2921 cm-1 range.
Preparation in un-degassed solutions and/or in
conditions of ambient light would systematically
yield 2927 cm-1.
The absence of signal for the methylene unit in
the SFG spectrum confirms the good organisation
of the HSC9SH SAM on gold when it is grown in
degassed n-hexane and in the dark. In the region
of the ?(CH) bands, the only signals visible on
the SFG spectrum are CH3 peaks, which are
attributed to traces of solvent not visible in
the RAIRS spectrum because of their weak
intensity. An important new feature observed on
the SFG spectrum is the dip located at 2562 cm-1,
a frequency corresponding to free S-H. To our
knowledge, its observation by SFG was not
reported before. It is difficult to observe, due
to both its intensity which is close to the
detection limit and the fact that it decays with
time. Its weak intensity is not unexpected
considering that the absorbance of SH in the gas
phase is 14 times smaller than that of the methyl
bands. Its decay with time is in contrast to the
case of methyl bands which are observed for
months in the SAMs of alkanethiols. It is
attributed to photoinduced oxidation, since
recording SFG spectra implies exposure of the
molecules to visible laser light under ambient
conditions. For SAMs grown in ethanol (degassed
or not), ?as(CH2) appears at around 2927 cm-1.
The SH peak located at 2565 cm-1 was not visible
in RAIRS spectra, and it is also not observed in
SFG. In the SFG spectrum, the CH2 bands are
strong, which reveals the presence of a not-all
trans configuration.
C6SH and HSC5SH possess the same number of
methylene units. The SH peak located at 2565 cm-1
is more intense for HSC5SH than for C6SH, because
of the two SH groups. However, it remains weak by
comparison to the CH vibration signals, which, in
the gas phase, appears at 2927 cm-1 for the
antisymmetric vibration ?as(CH2) and 2854 cm-1
for the symmetric stretch ?s(CH2).
Conclusions and perspectives
A study of alkanedithiol SAMs on gold is
presented and a comparison with alkanethiol SAMs
is performed. SE, RAIRS and SFG show that well
organised HSC9SH SAMs, about 1 nm thick, can be
obtained in degassed n-hexane solutions with all
the preparation procedure performed in the
absence of ambient light. SFG shows that the SAMs
have free standing SH groups. TOF-DRS
measurements show the presence of sulphur on the
SAM indicating standing-up arrangement. RAIRS
and SFG show that SAMs formed in ethanol are not
well organised. SE shows that in this case the
thickness of the SAM is somewhat smaller than for
the one prepared in degassed n-hexane, but would
appear to be compatible with standing up
molecules. These observations could be compatible
with the formation of disulfide bridges on top of
the SAM as suggested by calculations by
Esplandiu, Patrito et al. 9, which also show
that a stable arrangement corresponds to
distorted molecules. The effect of ambient light
and laser intensity on the SAM was noted
indicating instability, probably related to
photooxidation of free SH groups. The procedure
of dithiol SAM preparation could thus be useful
in applications involving growth of metallic
films and nanoparticles, as in molecular
electronics.
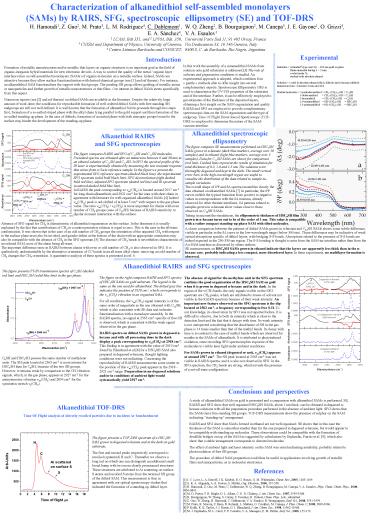
Alkanedithiol TOF-DRS Time Of Flight analysis of
directly recoiled particles due to incident Ar
bombardment
The figure presents a TOF-DRS spectrum of a
HSC9SH SAM grown in degassed n-hexane and in the
dark on gold substrate. The first and second
peaks respectively correspond to recoiled
(sputerred) H and C. Thereafter we observe a long
tail on which one can distinguish an additional
small broad hump with two more clearly pronounced
structures. These structures are attributed to Ar
scattering on surface S atoms and recoiled S
atoms from the terminal SH group of the dithiol
SAM. This measurement is thus in agreement with
our optical spectroscopy studies that indicated
the formation of a standing up dithiol layer.
References
1 J. C. Love, L. A. Estroff, J. K. Kriebel, R.
G. Nuzzo, G. M. Whitesides, Chem. Rev., 2005,
1103-1169. 2 A. K. A. Aliganda, A.-S. Duwez, S.
Mittler, Org. Electron., 2006, 337-350. 3 H.
Hamoudi, Z. Guo, M. Prato, C. Dablemont, W. Q.
Zheng, B. Bourguignon, M. Canepa, V. A. Esaulov,
Phys. Chem. Chem. Phys., 2008, 6836-6841. 4 M.
D. Porter, T. B. Bright, D. L. Allara, C. E. D.
Chidsey, J. Am. Chem. Soc., 1987, 3559-3568. 5
B. Bourguignon, W. Zheng, S. Carrey, F. Fournier,
H. Dubost, Chem. Phys. Lett., submitted. 6 Z.
Guo, W. Zheng, H. Hamoudi, C. Dablemont, V. A.
Esaulov, B. Bourguignon, Surf. Sci., 2008,
3551-3559. 7 M. Prato, R. Moroni, F. Bisio, R.
Rolandi, L. Mattera, O. Cavalleri, M. Canepa, J.
Phys. Chem. C, 2008, 3899-3906. 8 P. Kohli, K.
K. Taylor, J. J. Harris, G. J. Blanchard, J. Am.
Chem. Soc., 1998, 11962-11968. 9 M. J.
Esplandiu, M. L. Carot, F. P. Cometto, V. A.
Macagno, E. M. Patrito, Surf. Sci., 2006, 155-172.
Recommended
