
Sample characteristics PowerPoint PPT Presentation
1 / 25
Title: Sample characteristics
1
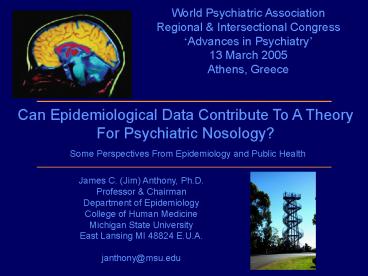
World Psychiatric Association Regional
Intersectional Congress Advances in
Psychiatry 13 March 2005 Athens, Greece
Can Epidemiological Data Contribute To A
Theory For Psychiatric Nosology? Some
Perspectives From Epidemiology and Public Health
James C. (Jim) Anthony, Ph.D. Professor
Chairman Department of Epidemiology College of
Human Medicine Michigan State University East
Lansing MI 48824 E.U.A. janthony_at_msu.edu
2
Epidemiologys Potential Contribution To Probe
and To Test Nosological Theory, Within Its Limits.
Theory
Challenge via Clinical Laboratory Observation
Challenge via Epidemiological Observation
3
Epidemiologys Strength Observations About
Untreated Cases
Treated Cases
Untreated Cases
Enthusiasm for the Study of Untreated Cases,
With Some Notes of Caution
4
Error
Clinical Features And Laboratory Findings, As
Observed
Clinical Features And Laboratory Findings, As
Observed
Case Class Non-Case Class
Underlying Gaussian Dimension
A Latent Class Approach (Categorical) In
Complement With A Latent Trait Approach
(Dimensional)
5
(No Transcript)
6
New Epidemiological Evidence
Multiple Nations or Sub-Nation Regions (gt25)
Transversal (Cross-Sectional) Research Design
Community Respondents Age 15 or 18
Multi-Stage Probability Sampling Large Samples
Standard Variable Definitions Specifications
Standardized Diagnostic Assessments
Analysis Methods to Account for Non-Response
7
Sample characteristicsAmericas
8
Sample characteristicsEurope
9
Sample characteristicsMiddle East/Africa
10
Sample characteristicsAsia
11
Estimated prevalence of recently active mental
disorders.Data from the WMH-CIDI/DSM-IV
survey.( with a disorder active within 12
months of survey date)
Estimated With Any Recently Active Mental
Disorder Under Study
Prevalence
12
Estimated prevalence of recently active anxiety
disorders.Data from the WMH-CIDI/DSM-IV
survey.( with a disorder active within 12
months)
Estimated With Recently Active Anxiety Disorders
Prevalence
13
Estimated prevalence of recently active mood
disorders.Data from the WMH-CIDI/DSM-IV
survey.( with a disorder active within 12
months)
Estimated With Recently Active Mood Disorders
Prevalence
14
Estimated prevalence of recently active drug
disorders.Data from the WMH-CIDI/DSM-IV
survey.( with a disorder active within 12
months)
Estimated With Recently Active Drug Dependence
or Related Disorders
Prevalence
15
Estimated proportion of the population receiving
mh care.Data from the WMH/CIDI-DSMIV surveys.
Estimated of the community population receiving
mh care
Percent in Treatment
16
Estimated proportion of serious cases in
treatment.Data from the WMH/CIDI-DSMIV surveys.
Estimated of serious cases in treatment
Spain
France
Belgium
United States
Netherlands
Germany
Colombia
Mexico
Ukraine
Lebanon
Percent in Treatment
17
Estimated proportion of mild cases in
treatment.Data from the WMH/CIDI-DSMIV surveys.
Estimated of mild cases in treatment
Percent in Treatment
18
In General, A Minority of the Active Cases Are
Being Seen By Expert Clinicians.
Treated Cases
Untreated Cases
When Does An Epidemiologically-Based
Nosology Converge With A Clinically-Based
Nosology?
19
An Example from the USA
- Population Under Study
- Pupils who entered 19 urban primary schools in
1985-86 - Sampled, Traced, and Ultimately Assessed in
2000-2002 - n1,692 (75 of the original sample)
- Based on standardized (UM-CIDI) assessment
- 486 had experienced a depression syndrome
episode - Of these, 155 (32) had seen a doctor about the
episode - 231 never even talked with a doctor about the
depression. - Standard Latent Class Analyses were conducted
- Latent Gold software
- Formal goodness of fit tests
20
Bad News? Different Results From Latent Class
Analysis
Clinically Recognized Cases, CRS (n155)
All Those With Episodes (n486)
15
36
45
64
60
TWO-CLASS RESULT 36 (n56) in severe class
THREE-CLASS RESULT 15 (n70) in severe
class 45 (n214) in moderate class
denotes 155 seen by doctors
21
Good News? The Severe Classes Resembled One
Another
Amongst Severe Cases Seen By Clinicians (n56)
Amongst All SevereCases (n70)
Tired all the time, 68
Want to avoid social contact, 78
Want to avoid social contact
Tired all the time
Trouble sleeping
Trouble sleeping
Fidgety and restless
Trouble concentrating
Anhedonia
Anhedonia
Trouble concentrating
Feeling worthless, guilty
Thoughts about death
Loss of confidence/assertion
Feeling inferior to others
Fidgety and restless
Slowed thoughts
Feeling worthless, guilty
Thoughts about death , 64
Slowed thoughts, 51
22
Suicide-Related Disturbances Discriminate
Severe From Moderate, But Not Clinically
Recognized Severe (CRS) From All Severe With
Episodes (SEV)
Estimated Occurrence of Each Clinical Feature ()
CRS (n56)
SEV (n70)
MOD (n214)
23
We Can Expect More Comparative Studies of This
Type
There Is Widespread Enthusiasm for Both Latent
Class (Categorical) and Latent Trait
(Dimensional) Solutions, Particularly When The
Epidemiological Evidence Conform With Expert
Clinical Judgments.
But Caution is Needed
When Differences Appear, The Source
of Discrepancy Often is Not Clear. We Will Need
To Proceed With Caution.
24
Epidemiologys Potential Contribution To Probe
and To Test Nosological Theory, Within Its Limits.
Theory
Challenge via Clinical Laboratory Observation
Challenge via Epidemiological Observation
25
(No Transcript)
Recommended
