
Virtual Ice Charting System PowerPoint PPT Presentation
1 / 8
Title: Virtual Ice Charting System
1
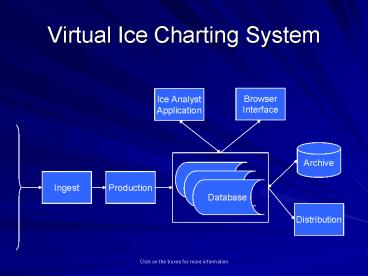
Virtual Ice Charting System
Browser Interface
Ice Analyst Application
Archive
Ingest
Production
Distribution
Click on the boxes for more information
2
Ingest
- Data from different sources are ingested and
made ready for further production, including
formatting.
3
Production
- Production includes rectification, compositing
(spectral, spatial and time), value adding, e.g.
production of SST fields and SAR filtering.
4
Database
- The database is an online representation of data
and products relevant for the ice analyst, e.g.
images, old ice charts, wind fields etc. There
may be one or several databases.
5
Archive
- Holds the offline data and product catalogue.
6
Distribution
- Methods for distribution of data and products to
end users.
7
Browser Interface
- An application enabling the user to browse the
(metadata) database.
8
Ice Analyst Application
- Consists of two main modules
Ice analysis production Image display Vector
overlay Vector editing Attribute entering Quality
control Input of metadata
Ice Chart Production Conversion to WMO
nomenclature Chart production Egg tools Chart
layout Projection
Recommended
