
Magnetic Properties of Pyridinedicarboxylate Copper Dihydrate Alexander Parent 08 Clark University S PowerPoint PPT Presentation
1 / 1
Title: Magnetic Properties of Pyridinedicarboxylate Copper Dihydrate Alexander Parent 08 Clark University S
1
Magnetic Properties of Pyridinedicarboxylate
Copper DihydrateAlexander Parent 08 Clark
University (Sponsor Dr. Mark Turnbull)
Abstract Crystals of Pyridinedicarboxylate
Copper Dihydrate, (pdc)Cu2H2O, were produced via
slow water evaporation in a variety of heat
conditions. The crystals produced were
identified by comparing their X-ray diffraction
patterns with the theoretical values. Magnetic
data was then collected on the crystals using the
SQUID magnetometer. Two phases of crystals are
produced by this method, one ferromagnetic, the
other anti-ferromagnetic. To date, only one of
the phases has been harvested with a high enough
purity to yield publishable results. Introduction
The Turnbull-Landee research group is
investigating the relationship between the
crystal structures and the magnetic properties of
compounds of the form (L)nM, where M is a metal
and L is an organic ligand. By varying the ligand
very different magnetic properties and crystal
structures have been observed. Many of the
compounds exhibit ferromagnetic or
anti-ferromagnetic properties. In a ferromagnet
the domains of the compound align parallel at low
temperatures leading to a summation of the
compounds magnetic moments. In an
anti-ferromagnet the domains of the compound
align anti-parallel, resulting in a near negation
of the total moment. These effects can be
observed through a SQUID magnetometer, which
applies a constant field to a small sample of
compound while varying the temperature of the
sample. A graph is made of the compounds
susceptibility multiplied by the temperature vs.
the temperature and from this conclusions are
drawn. The synthesis of the pyridinedicarboxylate
copper dihydrate was undertaken following a
previous experiment performed by Dr. Turnbull
that produced the two phases in an inseparable
state. Preliminary data indicated that one of
these phases was ferromagnetic, and the other
anti-ferromagnetic. Both of the crystal phases
have had crystal structure data published, the
ferromagnetic phase by Cingi and the
anti-ferromagnetic phase by Koman. Using this
data it is possible to identify crystals using an
x-ray diffractometer (XRD). Conclusion The
anti-ferromagnetic phase was successfully
isolated by running the reaction in the cold
room. Data is still being collected on the
crystals in their pure form. The preliminary data
clearly shows that this phase is
anti-ferromagnetic, and analysis of the pure
substance will allow for the calculation of the
strength of the magnetic interactions. The
ferromagnetic phase has not yet been isolated
pure, although we have several new ideas on how
to improve yield and purity. References Cingi,
M.B. Villa, A.C. Guastini, C. Nordelli, M.
(1971). Gazz. Chim. Ital. 202, 825. Koman, M.
Moncol, J. Hudecova, D. Dudova, B. Melnik, M.
Korabick, M. Mrozinski, J. (2001) Polish Journal
of Chemistry. 75, 957-964.
Experimental In the first synthesis, 2.416g
(10mmol) Cu(NO3)23H2O was dissolved in 10mL of
water. 1.672g (10mmol) pdca was then mixed with
20mL of water in a separate container. .799g
(20mmol) of NaOH was dissolved in the pdca
solution. An extra .012g of NaOH was added to
completely dissolve the pdca. The copper nitrate
solution was then added to the pdc solution.
Precipitate formed during the addition. The
precipitate was removed by vacuum filtration, and
the solution was left to evaporate. The
precipitate was identified as containing the
desired product by IR spectroscopy, and was
dissolved in 450mL of water under gentle heating
and stirring. The final solution was dark blue
and a small amount of remaining white precipitate
was removed by vacuum filtration. An 100mL
sample was removed from the solution and placed
in the cold room to evaporate. The crystals from
the original solution were isolated by vacuum
filtration and washed with a small amount of cold
water. The crystals were separated by eye under a
microscope into two phases, with the smaller
crystals remaining unidentified. The crystals
formed from the re-dissolved precipitate
contained a clear impurity, which was removed by
washing with a small amount of 66mM nitric acid.
A portion of the inseparable crystals were
re-dissolved in water, with a the remainder of
the crystals added as seeds. The cold-room
crystals were then filtered and washed with cold
water. The final mass of the recrystallized
product was .108g. The mass of the product from
the cold-room was .118g. The crystal phases were
then separated by density difference in a
solution of bromoform and THF. The isolated
anti-ferromagnetic phase had enough mass to
analyze with the XRD and SQUID. The XRD showed
the phase contained impurity, but were pure
enough to obtain preliminary magnetic data. The
rest of the isolated crystals decomposed before
they could be studied. In the second synthesis
1.21g (5mmol) of Cu(NO3)23H2O was added to 10mL
of water, and .836g (5mmol) pdca was added to
200mL of water in another container. .405g
(10mmol) of NaOH was added to the pdca solution,
and an additional 14mg was added to attain full
dissolution. The copper nitrate solution was then
added to the pdc solution, which was placed in
the cold room. The product was filtered upon the
initial appearance of the white byproduct, washed
with dilute nitric acid, and the remaining
product was replaced in the solution as seeds.
After a large number of crystals had formed the
solution was filtered and the crystals were
separated by density difference. The XRD
indicated that the less dense phase was a pure
form of the anti-ferromagnetic phase, and that
the lower phase was just the anti-ferromagnetic
phase containing impurities. The total mass of
the upper phase was .75g. In the third synthesis
the second procedure was repeated, but instead of
placing the solution in a cold room it was placed
in a hot water bath. The separated crystals
contained enough of the ferromagnetic phase to
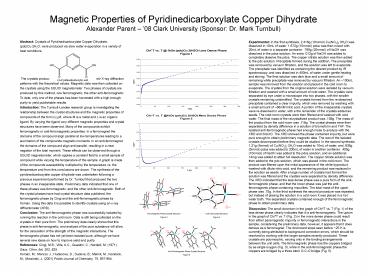
obtain preliminary data. Discussion The small
downturn in the graph of ChiT vs. T (Fig. 1) of
the less dense phase clearly indicates that it is
anti-ferromagnetic. The upturn in the graph of
ChiT vs. T (Fig. 2) in the more dense phase
could result from either paramagnetic impurity or
ferromagnetic interactions in the sample,
considering the preliminary data, however, it
appears that it does behave as a ferromagnet. The
downward slope seen before 25 K is currently
being attributed to background correction errors,
which should be resolved by working with the
larger samples recently produced. These crystals
are polymorphic, varying only in the binding
arrangements between the unit cells. The
ferromagnetic phase has the coppers bridged by as
single oxygen (Fig. 3), while in the
anti-ferromagnetic phase the coppers are bridged
by a three atom O-C-O bridge (Fig. 5).
Recommended
