
Tenerife gecko PowerPoint PPT Presentation
1 / 65
Title: Tenerife gecko
1
(No Transcript)
2
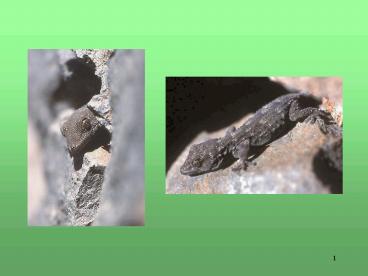
Tenerife gecko
- Distribution Canary Islands
- It has been suggested that individuals of this
species vary in size between islands - Use body length to assess body size difference
- Plan take a random sample of 30 individuals per
island - H0 length does not differ between islands
- H1 length does differ between islands
3
The circled islands were included in the study
4
(No Transcript)
5
Gecko example
- H0
- H1
- H0
- H1
- .
- .
- .
- H0
- H1
From previous lecture two sample hypothesis In
this case we would need to test all pairwise
differences among all sampled populations. Since
we have 5 populations we need to make 10
simultaneous pairwise t-tests
6
If two sample hypothesis test is used
- For each separate test we have a
- significance level of
- The probability of making a type I error
rejecting a - true null hypothesis
- The probability of NOT making a type I error
7
The real significance level for all 10
simultaneous tests
- The probability of not making a type I error in
- any of the tests is
- The probability of making a type I error in at
- least one of the 10 tests is
8
The real significance level
- The probability of not making a type I error in
- any of the tests is
- The probability of making a type I error in at
- least one of the 10 tests is
- HUGE!
9
- So why do we not just make smaller?
- For example if we solve
- We get
- However, remember from last lecture If you
decrease - the Type I error you increase the type II error,
- meaning that you are reducing the statistical
- power of each test.
- So, if other analyses are available with
- a higher power choose that instead!
10
- We are considering if there is a difference in
the body lengths - of the geckos. We therefore want to write our
hypothesis in - the form that there is NO difference among the
islands. - Denote the expected mean for each island
population i as - i1,..,5. Our hypothesis is then
- H0
- H1 the body length is not the same on all
islands
11
We make two important assumptions
- Body length has a normal distribution within each
- island.
- This variable has the same variance on all
islands
12
- Body length is the variable we are testing
- Island is a factor that we want to make
- inferences about
- Each island is a level of the factor
- So, in this example there is one factor with five
levels
13
- 1) Our null hypothesis states that all islands
have - the same expected mean.
- 2) We made the assumption that body length has a
normal distribution. - 3) We also assumed that all populations had the
same variance. - So the null hypothesis basically says that we
- should consider all islands as one big
- population with the same expected mean and
- variance.
14
Say that the null hypothesis is true
- And that expected mean is 22.6 while the
- variance is 5.
- Even if the five islands have exactly the same
- distribution, it does not mean that they are
- going to produce exactly the same
- observations.
15
These 5 samples (each with 1000 individuals) have
been sampled from exactly the same normal
distribution with expected mean 22.6 and variance
5.
16
These 5 samples (each with 15 individuals) have
been sampled from exactly the same normal
distribution Conclusion even if the null
hypothesis is true we do not expect to find
exactly the same mean and variance for each
island. There is going to be some differences
just by chancesampling error.
17
- 1. If the null hypothesis is true
- A) There is going to be some differences among
- populations that has to do with sampling from a
probability - distribution
- 2. If the null hypothesis is not true there
- A) There is going to be some differences among
- populations that has to do with sampling from a
probability - distribution
- B) There is going to some differences among
populations that - has to do with actual difference between the
means among the - islands
18
Means Island 1 25 Island 2 20 Island 3
18 Island 4 28 Island 5 22
These islands are sampled from populations with
variance (4) .
19
Means Island 1 25 Island 2 20 Island 3
18 Island 4 28 Island 5 22
These islands are sampled from populations that
have variance (100). Compare the means with the
previous slide, they are the same but the outcome
look very different due to difference in variance!
20
- In the first case we had a small variance
- within each population, in the second the
- variance is much larger. The means were exactly
- the same in the two examples.
- We therefore need to construct a test that
- compares the difference between the islands
- and at the same time takes the within island
variation - into account!
21
ANOVAANALYSIS OF VARIANCE
- Idea Partition the total variation into
variation - within islands and variation among islands
- SSTSSISLANDSSE
- These sums of squares are then used to estimate
the MSISLAND - and MSE (MSmean square) which we use in the
actual test
22
Sum of squares total SST
- To get the variation for the whole data set
- 1. Calculate the average for all
observationsgrand mean - 2. Obtain the difference between an observation
and the grand mean - 3. Square the difference
- 4. Repeat for each observation (we have 530150)
- 5. Add up all squared differences and you have
SST
23
Sum of squares error SSE
- To get the variation within each island
- 1. Calculate the mean for the island
- 2. Obtain the difference between an island
observation and the island mean - 3. Square the difference
- 4. Repeat for each island observation
- 5. Add up all squared differences
- Then add up all islands and you have the SSE
24
To get then get the Mean Square Error term MSE
- Divide the SSE with degrees of freedom for
- the error
- So what is this?
- This an estimate of
- the within population variance
25
Sum of squares islands SSISLAND
- To get the variation among islands
- 1. Calculate the mean of each island
- 2. Calculate the grand mean, the mean of all
observations in study - 3. Obtain the difference between the an island
mean and the grand mean - 4. Square the difference
- 5. Repeat for each island mean
- 6. Add up all squared differences
- This is the SSISLAND
26
To get the Mean Square Island term MSISLAND
- Divide the SSISLAND with degrees of freedom
- for the island
- (degrees of freedom islands 5-1 4)
27
- If the null hypothesis is true then we would
- expect the variation between islands to be
- small compared to the variation within islands
- So should be small. How small?
- If the null hypothesis is true then
- have a F-distribution with dfisland, dferror
28
How do I get the degrees of freedom for the error
term?
- dftotal is 530-1149
- dfisland is 5-14
- We know that dftotaldfislanddferror
- dferrordftotal-dfisland 149-4145
29
The test itself
- Calculate the F
- If Fgt then reject the null
hypothesis - Note that we are only interested if MSISLAND is
large in - comparison to MSE, not the reversed situation,
this is why we - are using a one-tailed test
30
Each observation can be described as a linear
statistical model
i1,,a j1,..,n Where where
is the population mean, Ai is the effect of
level i of factor A, and is the random
error component
31
This looks much worse than it is!
- We can break it down in the following way
This is not true in a strict sense
This is how far away the observation is from the
mean of that specfic level
This is how far away the mean of that specfic
level is from the total mean
32
Random versus fixed effects
- We are looking at the effect the factor island
- has on the body length of these geckos.
- Fixed effect the experimenter chooses the levels
of the factor for whatever reason - Random effect the experimenter randomly selects
a set of all possible levels that can be studied
33
- Fixed effect model
- you can only draw conclusions for the levels
investigated - Random effect model
- you can make inferences on the whole set of
levels - So how does this apply to our gecko example for
- Do not reject null hypothesis
- Reject null hypothesis
34
Purple sandgrass (Triplasis purpurea)
35
Some background
- In coastal ecosystems, two important abiotic
- factors which influence growth and
- reproduction of plants are
- Airborne saltwater spray
- Sand deposition
- It has been suggested that some species have
evolved - adaptation (tolerance) to airborne salt
36
Research question
- What is the impact of both saltwater spray and
- partial sand burial of seedling on plant growth
- and seed production?
- Adapted from American Journal of Botany 86
703-710. 1999.
37
- Investigated variable shoot mass
- 135 hundred seedlings are randomly selected
- at a beach and returned to greenhouse and
- then planted into pots
38
Two factors
- Factor A saltwater spray
- Levels
- No spray
- 2 sprays/week
- 6 sprays/week
- Factor B sand burial
- Levels
- 1) unburied
- 2) buried to 50 height
- 3) buried to 75 height
39
This design allows us to set up the following
hypotheses
- H0 There is no difference between the different
levels of burial. - HA There is difference between the different
levels of burial. - H0 There is no difference between the different
levels of saltwater - spray.
- HA There is difference between the different
levels of saltwater - spray.
- H0 There is no interaction between saltwater
spray and burial. - HA There is interaction between saltwater spray
and burial.
40
observations
41
- Linear model
- Partition the sums of squares just like for the
- one way ANOVA
42
(No Transcript)
43
Conclusion Both Burial and Spray show
significant effect on shoot mass. But there is no
interaction. WHY? Do we get the whole story from
this analysis?
44
- If you get significant results in an ANOVA you do
- not know which levels are significantly different
- from each other.
- Subsequent testing may therefore be done such as
for - example Tukeys test and and other available
- comparisons (we will not cover this here)
- In our purple sandgrass example
- saltwater spray had a negative effect on the
shoot - mass while the more buried the larger the shoot
mass - Adaptation to sand deposition on seedlings?
- Adaptation to saltwater spray on seedlings?
45
Barn Swallows in Ukraine
- Partial alibinism in barn swallows generally
- rare, less than 1
- In Chernobyl this frequency is 13-15
- Albinism is usually due to mutation, in Chernobyl
it - is probably elevated due to radioactive
- contamination (nuclear catastrophe in May 1986)
46
(No Transcript)
47
- Research question Are albino barn swallows
- smaller than non-albino?
- If this is true then it could then in turn have
- implications for the evolution of the barn
swallows. - If albinism is NOT decreasing due to natural
- selection, then barn swallows in this area are
- expected to get smaller.
- If albinism is affected by natural selection then
the - frequency of albinism should decrease with time.
48
- Null hypothesis There is no difference in body
size - between albino birds and wildtype (non-albino)
birds - Problem Males and females may not have equal
size, - so variation in our error term may come from
that. - Include sex as factor.
- Additional Null Hypothesis There is no
difference in - body size between males and females
49
Samples came from 3 different years 1991, 1996,
2000
- Problem There might be an effect of the year of
- sampling on the body size of the barn swallows
- Hypothesis There is no difference in size
between - years.
- In, addition, there could be interactions among
the - three different factors. These need also to be
tested
50
Linear model
Möller et al. (1997) chose to test the following
variables Body mass (and some other variables
too)
51
(No Transcript)
52
ANOVA
53
- What if we know that our observations are subject
to a heterogeneous environment? - This is likely to cause variation that has
nothing to do with the variable we are testing
and therefore ends up in the error term. - Consequence?
54
- Willow breeding
- Research question Is the impact of inbreeding
after 4 generations of full-sib mating the same
for each inbred line? - Variable Seedling height 2 weeks after
germination, since this is - thought to be a very important trait for
survival in willows - H0 The seedling height is the same for all
inbred lines - H1 The seedling height is not the same for all
inbred lines
55
Experiment
- Greenhouse experiment Potential environmental
- differences in the green house
- I therefore created a block experiment in the
- following way I divided my area in the green
house - into 4 sub areas of equal size
- For each of the 11 inbred lines I planted 100
seeds. I - randomly assigned each seed to each block so that
I - in the end planted 25 seeds in each block
56
- Block is variable and it has in this case 4
- levels. This changes my regular one factor
- model
- to
- So what is so good about that?
57
- It will make SSE smaller since instead of
- SSTSSLINESSSE
- Some of the variation in SSE that had to do with
- heterogeneous conditions in my green house space
is - now included in the SSBLOCK
- SSTSSLINES SSBLOCK SSE
- The reason for this is that SST does not change
- because you introduce an extra variable
- Ok, but the question remains What is the point?
58
- This will lead to an improved estimation of MSE.
- The F ratio is F
- If MSE gets smaller then F gets larger and we
- are more likely to correctly reject the null
- hypothesis if it fact is not true.
- (In my experiment I had a HUGE block effect and
- there was a significant difference between the
inbred - lines)
59
Nested ANOVA
- In some multifactorial ANOVAs the
- levels of one factor are similar but not
- identical. We say that levels of one factor are
- nested within the levels of another factor.
60
The purple sandgrass is not a nested design
61
The butterfly Scarce heath (Coenonympha hero)
62
- Background Population sizes of this butterfly
differ - dramatically.
- Reduced population size is thought to increase
- something called inbreeding depression (such as
- reduced weight of larvae). In summary small
- population size can in the long run negatively
- influence the survival and reproduction of
individuals - Research question Is there an effect of
population - size on the weight larvae?
63
- Nine populations were classified as either large
or small - Females were sampled at random from the nine
populations. - Weights were recorded for a total of 81 offspring
larvae (3 - from each female).
- Adapted from Cassel et al. (2001) Effects of
population size - and food stress on fitness-related characters in
the scarce - heath, a rare butterfly in Western Europe
Conservation - Biology 15 1667-1673
64
- Experimental design Population size is a factor
and - female is also a factor (why?), each female have
3 - offspring
- Population size
- Large
Small - Females 1, 2, 21
22,, 27 - Offspring 1,2,3 1,2,3 1,2,3
1,2,3 1,2,3 - It is not possible that a female can end up under
both levels of - population size. A female either comes a from a
large - or a small population.
65
No interaction term in model
- Due to the design of the experiment is it not
- possible to obtain any interaction term between
the - nested factor (female) and the factor it is
- nested within (populations size).
- A nested and a two factor ANOVA are different!
- Which in turn can lead to very different results
and - conclusions.
Recommended
