
Powerpoint template for scientific posters (Swarthmore College) PowerPoint PPT Presentation
1 / 1
Title: Powerpoint template for scientific posters (Swarthmore College)
1
Combining Efforts to Conduct Shallow Water
Quality Monitoring in Maryland Using High Speed
Spatial Mapping and Continuous Monitoring
Amy F. Drohan1 Eva M. Bailey2, Walter R.
Boynton2, Christopher E. Tanner1, and Robert W.
Paul1, St. Marys River Project, St. Marys
College, St. Marys City, Maryland
2068621Chesapeake Biological Laboratory,
University of Maryland Center for Environmental
Science, Solomons, Maryland 206882
Introduction The St. Marys River Project (SMRP)
is a state funded program that investigates
matters related to water quality and ecological
health and uses this information to protect,
restore and manage the historic and ecologically
important St. Marys River and nearby
tributaries. The SMRP program is made up of one
full time research coordinator, two principal
investigators, and students from St. Marys
College of Maryland. The students along with the
research coordinator conduct the field work and
collect data from March through October. SMRP
works closely with the Chesapeake Biological
Laboratory (UMCES-CBL) in conducting its shallow
water quality monitoring for Maryland Department
of Natural Resources (MD-DNR) throughout the St.
Marys River, Patuxent River, and numerous other
water bodies in the Chesapeake Bay watershed. CBL
is contracted by SMRP to analyze the water
quality data which is sent to MD-DNR where it is
published on their website Eyes on the Bay
http//mddnr.chesapeakebay.net/eyesonthebay/index.
cfm. The ecology research group at CBL has been
conducting their own shallow water monitoring
throughout the Patuxent River and nearby water
bodies for many years using high speed mapping
techniques and continuous monitoring. They
monitored the water quality in the Patuxent River
after one particular storm event in June of 2006
at the request of the Chesapeake Research
Consortium. Around the same time SMRP was
collecting within the St. Marys River using
Dataflow and Continuous Monitoring data sondes
(ConMon). The mid-Atlantic coast is an area that
is subject to occasional severe storms. Over the
period of June 24-28, 2006 the Chesapeake Bay
region experienced a rainfall event comparable to
1972s devastating tropical storm Agnes. The
region received an average of over 8 inches of
rain during a 4 day period. Daily flows were
measured at about 1/3 of those during Agnes.
Results
Figure 7b
Figure 7a
Figure 9c
Figure 4b
Figure 4a
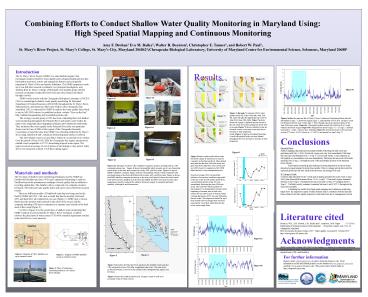
Figure 7a through 7c represent CBLs water
quality results for 4 days (June 8th, 30th, July
5th, and 10th) after the significant rain event
in June 2006 (June 24th-26th). Figure 7a shows
dissolved oxygen is depleted upriver closest to
the rain event and as time progresses levels
start to increase Figure 7b shows turbidity
levels are elevated closest to the storm event
and start to decrease as time progresses. Lastly,
Figure 7c depicts chlorophyll densities. Overall
chlorophyll levels are more diluted throughout
the river and start to increase as time
progresses.
Figure 7c
Figures 9a thru 9c represent the St. Marys River
Continuous Monitoring Station data for
chlorophyll a (ug/L-1), dissolved oxygen
(mg/L-1), and turbidity (NTU) at St. Georges
Creek for the dates between June 21 thru July 5,
2006. Shaded aqua areas represent dates of the
June 2006 storm event. Figure 9a, Chlorophyll
spiked around July 2nd from 8 to 10 µg/L whereas
dissolved oxygen (Figure 9b) dropped from about 6
mg/L-1 to 2.5 mg/L-1 and then increased to
7mg/L-1 the next day. Turbidity (Figure 9c)
decreased closer to the rain event on June 27th
from 9 NTUs down to 3.5 NTUs and stayed low
until July 1st. Conclusions Patuxent River
Surface mapping data indicated increased
turbidity following the rain event and persisting
until July 5, 2006. Dissolved oxygen was very low
immediately following the rain event and remained
low (lt 5 mg L-1) for several weeks. A clear
response in chlorophyll-a concentrations was seen
immediately following the rain event with levels
reaching over 20 µg L-1 throughout most of the
mesohaline portion of the Patuxent River
Estuary. Fixed station monitoring data indicated
a strong depression in bottom water dissolved
oxygen lasting for about three months. This is a
longer period that would be expected given that
this was, aside from the storm, an average flow
year. St. Georges Creek ConMon data indicated
for the 2 week period during and after the storm
event in June 2006, that chlorophyll increased
from 10 to 14µg/L-1. Dissolved oxygen remained
between 4 and 7 mg/L-1 throughout the rain event
and on June 27th dropped down to 2mg/L-1.
Turbidity mostly remained consistent between 4
and 9 NTUs throughout the rain event and after.
Combining the results from high speed mapping
and continuous monitoring helps show the
responsive nature of these systems and is
consistent with the idea that these estuaries
will also rapidly respond to load reductions due
to management actions.
Figure 4d
Figure 4c
Figure 8
Figure 8 depicts surface and bottom water
dissolved oxygen at station LE1.2 (near St.
Leonard) on the Patuxent River. Blue shaded area
indicates the June 2006 rain event and grey data
shows data from a dry (2002) and wet (2003) year
for comparison. MD-DNR data from
http//www.chesapeakebay.net. Dissolved oxygen
(DO), an important indicator of ecosystem
condition, responded to the rain event in both
surface and bottom concentrations Surface water
DO rose immediately following the June 2006 rain
event. This contrasts with the pattern of
decreasing DO as temperatures increase at the
beginning of summer seen in both a dry (2002) and
wet (2003) year. In bottom waters a strong
depression of DO was seen following the rain
event. This depression lasted for up to three
months and was longer than would be expected for
a year that, other than the rain event, had
average flows.
Figure 4f
Figure 4e
Figures 4a-4f. Figure 4a shows CBLs dataflow
computer, monitor, and keyboard in a self
contained pelican case. Figure 4b shows the
manifold which is made out of a pvc frame that
stands alone on the deck and contains the sonde,
GPS, and flow meter. Figures 4c depicts SMRPs
dataflow computer, Figure 4d shows the manifold,
which is made of plastic board and stands alone
on the back deck fitted with a sonde, GPS, and
flow meter. Figure 4e shows the SMRP dataflow
computer hooked up on the boat, and Figure 4f
shows the model sonde (YSI 6600) used for
dataflow by both CBL and SMRP. The 6600 YSI sonde
records water temperature, specific conductivity,
salinity, dissolved oxygen saturation and mg/L,
turbidity, chlorophyll, and fluorescence.
Materials and methods The two types of shallow
water monitoring techniques used by SMRP are
Dataflow (Maddent and Day 1992) and Continuous
Monitoring (ConMon). Dataflow provides
instantaneous readings of water quality data in
addition to recording spatial data. The dataflow
unit is composed of a computer, monitor,
keyboard, GPS unit and water quality meter and
can be moved between research vessels. There are
different models of Dataflow units that are
being used in the field by SMRP and CBL. CBL uses
a model that has the monitor, keyboard, GPS, and
hard drive all contained in one case (Figure 1).
SMRP uses a version that houses the monitor and
keyboard in the cabin of the vessel, and the
computer including GPS unit is contained in a
separate case located on the back deck of the
vessel (Figure 2). Con Mon (Figure 3) is the
second type of shallow water monitoring that SMRP
conducts in and around the St. Marys River
watershed. ConMon involves the placement of water
meters (YSI 6600 extended deployment sondes) in
the field for two week intervals.
Literature cited Boynton, W.R., S.M. Moesel, E.M.
Bailey and J. Anderson. 2006. Pages 3.1-3.19 in
Department of Natural resources/ Environmental
Protection Center Level 1 No. 24. Annappolis,
Maryland. EEG (Ecosystem Ecology Group). 2007.
Water quality. Accessed 26 October 2007.
http//www.gonzo.cbl.umces.edu. Acknowledgments SM
RP would like to thank MD DNR for the funding to
continue its monitoring projects in and around
the St. Marys watershed as well as the continued
support of Dr. Boyntons research team (CBL) and
facilities.
Figure 9a
For further information Please contact
afdrohan_at_smcm.edu and/or bailey_at_cbl.umces.edu.
More information on this and related projects can
be obtained at www.smrpweb.smcm.edu and
http//www.gonzo.cbl.umces.edu. This poster can
be found online at http//smrpweb.smcm.edu.
Figure 1. Diagram of CBLs dataflow set-up on
research vessel.
Figure 2. Diagram of SMRP dataflow set-up on
research vessel.
Figure 6
Figure 5
Figure 5 represents the Patuxent River and shows
the dataflow track map that CBL performed in June
2006 after a significant rain event. This rain
event produced between 12 and 16 inches of rain
in the Chesapeake Bay region over five
days. Figure 6 shows the ConMon station in St.
Georges Creek as well as its proximity to the
St. Marys River.
Figure 9b
Figure 3. Photo of continuous monitoring station
in a St. Marys River tributary.
Recommended
