
Stock and Recruitment PowerPoint PPT Presentation
1 / 19
Title: Stock and Recruitment
1
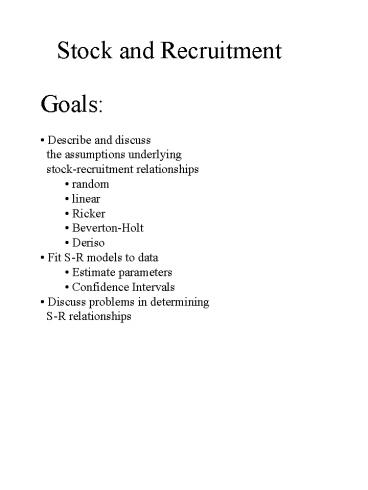
Stock and Recruitment
- Goals
- Describe and discuss the assumptions
underlying stock-recruitment relationships - random
- linear
- Ricker
- Beverton-Holt
- Deriso
- Fit S-R models to data
- Estimate parameters
- Confidence Intervals
- Discuss problems in determining S-R
relationships
2
Measuring Stock
- Ideally the of eggs laid
- Other approximations (in decreasing order of
preference) - females X fecundity
- individuals X mean fecundity
- biomass at or above age of first reproduction
- index of abundance during or near to spawning
Measuring Recruitment
- commercial fisheries data
- juvenile surveys
3
Examples of Stock-Recruitment
Sockeye
Herring
Halibut
Tiger Prawns
4
What can Stock-RecruitmentRelationships do for
us?
- Indicate the relationship between stock size
and productivity - relevant to management
- useful for input into more complex models of
fisheries systems - For some life-histories S-R parameters can be
used to directly calculate management
objectives (e.g. MSY stock size)
5
Semelparous
Stock
mortality
reproduction
RecruitsStock
reproduction
RecruitsStock
6
Processes AffectingStock-Recruitment
S-R curve shaped by mortalitybetween
reproduction and recruitment
Density-independent Mortality
- constant probability of survival at all stock
densities - monotonic increasing S-R
- expected at low stock size
- after strong exploitation
- variability around this trend
- may be large or small
7
Density-dependent Mortality
- varies with stock or recruits
- compensation
- mortality increases with abundance
- stock size
- crowding effects
- habitat quality gradients
- cannibalism
- disease transmission
- recruit numbers
- oxygen limitation
- food limitation
- depensation
- mortality declines with abundance
- constant predation (by number)
- Allee effects
8
Do the Following S-R CurvesIllustrate Density
Dependent Mortalityor Density-Independent
Mortality???
R
R
S
S
R
R
S
S
9
Modeling Stock-Recruitment
- ALL STOCHASTIC!!!
- Rough n Ready
- stocks between X and Y produce Z recruits, on
average - Tabular or Markovian
- Table of stock sizes (states) and recruitment
sizes - entries are probabilities
- Stock Recruits
- Low High
- Low 0.2 0.8
- High 0.5 0.5
- Continuous Relationships
- with variance estimates
- could be
- linear, Ricker, Beverton-Holt,...
10
Dr. William E. Ricker
BA 30, MA 31, PhD 35, Order of Canada. Died
September 8, 2001, at 93. Bill Ricker, as he was
known, was Canadas foremost fisheries scientist.
He wrote the book.
- A few of his accomplishments
- World authority on
- fisheries models statistics
- fisheries biology (esp. salmon)
- stoneflies
- Self taught in Russian (fluent)
- Amateur musician (Nanaimo Symphony)
- Author of poetry and fiction
11
Necessary Properties of Stock-Recruitment
Relationships
- Rickers Properties (classic view)
- Pass through origin (0,0)
- no stock - no recruits
- Any stock has some recruitment
- even high stock levels
- R/S declines with increasing stock
- esp. at high stock sizes
- Recruit MUST exceed stock over some range of
stock sizes - Hilborn Walters also suggest
- Continuity
- no sudden jumps
- Stationarity
- parameters dont change
- always assumed
- often wrong
12
Rickers Model
R recruits, S Spawners
- a) R,S measured as adults
- ea is initial slope of curve
- b is point where RS
- b) S as proxy (mass), R to age/size
- a is initial slope
- b is related to the rate of decline in R/S as
S increases
13
Biological Assumptionsof Ricker S-R Curve
- mortality of eggs juveniles is proportional
to spawning stock size - how could this happen? (previous list)
- OR density-dependent growth coupled with size
dependent predation - juvenile density(not stock)
- Big fish eat small fish
- slow growth vulnerable
14
Beverton-Holt Model
11
Recruits
Spawners
- a) a is maximum R
- b is point where Ra/2
- b) a is maximum R/S
- a/b is maximum R
- c) a as above
- b is maximum R
Model fitted (a-c) dependson measurable
quantities)
15
Biological Assumptionsof Beverton-Holt S-R Curve
- mortality due to juvenile competition
- food, space
- relevant density is
- eggs
- juveniles
- pre-recruits
- NOT spawning stock
- IN GENERAL
- many biological/environmental processes
influencing pre-recruit mortality - consider any S-R as statistical
- do not base choice on first principles (too
simple)
16
Deriso Model Distinguishing Models with Models
R aS(1-bcS)1/c eW
c - infinity R aS c -1 R aS/(1
bS) c 0 R aSe -bS
Model choice could be performedby fitting a,b,
and c. Alternatively, Use the fitted S-R
relationship (c ? -?,-1,0).
17
Confidence Intervals for S-R Parameter Estimates
- Standard linear estimators
- need proper error structure
- linear parameters may be combinations of
management parameters - Nonlinear Approximation
- methods provide poor 95 estimates (good
10-20) - no estimate of confidence in variance (req.
for prediction) - parameter combinations can still be awkward
- Computer Intensive Statistics
- Bootstrap, Jack-knife
- methods in development
18
Problems with Stock-RecruitmentAnalyses I
- Errors in estimation
- obscure relationship
- overestimate initial slopes
- stock appears more productive
- Time-series biases
- will occur if stock is allowed to vary freely
with recruitment - overestimate productivity (again)
- underestimate equilibrium
- test residuals
- autocorrelation r Nt, Nt1
19
Problems with Stock-RecruitmentAnalyses II
- Nonstationarity
- Stock-structure
- changes in age or spatial structure
- productivity changes
- Changing external variables
- physical environment
- predators/competitors/prey
- Lack of contrast
- small X range
- little to distinguish parameter estimates
Recommended
