
EOG AND NMP RESPONSES TO CO2 RECORDED FROM THE OLFACTORY AND RESPIRATORY EPITHELIA OF THE MOUSE PowerPoint PPT Presentation
1 / 1
Title: EOG AND NMP RESPONSES TO CO2 RECORDED FROM THE OLFACTORY AND RESPIRATORY EPITHELIA OF THE MOUSE
1
EOG AND NMP RESPONSES TO CO2 RECORDED FROM THE
OLFACTORY AND RESPIRATORY EPITHELIA OF THE MOUSE
E. Lee Coates, A.J. Kompel, Darrell. J. Voll
Neuroscience Program, Allegheny College,
Meadville, PA, 16335
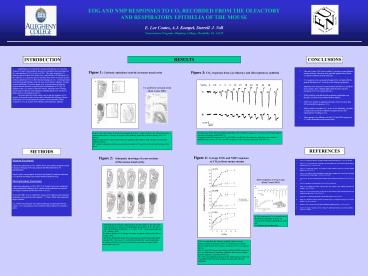
RESULTS
CONCLUSIONS
INTRODUCTION
Amphibians (7,11), lizards (1), and rats (5,6)
possess CO2-sensitive olfactory receptors that
mediate a decrease in ventilation when stimulated
by low concentrations of CO2 (as low as 0.5).
Like other respiratory CO2 chemoreceptors located
in the brain (2,8), carotid bodies (10), and
larynx (3) the olfactory CO2 chemoreceptors in
rats have been shown to use the enzyme carbonic
anhydrase (CA) to detect transient changes in
CO2. Histological and electrophysiological
studies using rats have shown that the olfactory
receptor neurons exhibiting CA activity appear to
be a special subset of olfactory neurons that are
sensitive to physiological concentrations of
CO2(6). In addition to the CO2-sensitive
olfactory neurons, trigeminal nerve endings
innervating the olfactory and respiratory
epithelia appear to be sensitive to higher
noxious concentrations of CO2. The main
objectives of this study were to map the
locations of CA activity in the nasal cavities of
mice and to determine the olfactory
(electro-olfactogram, EOG) and trigeminal
(negative mucosal potential, NMP) responses to
CO2 in regions of the olfactory and respiratory
epithelia.
- Like rats (Coates, 2001), mice exhibit CA
activity in some olfactory receptor neurons.
However, mice generally appear to have fewer
CA-positive olfactory neurons than rats. - CO2 responsive sites, as measured using EOGs,
correlate with the general distribution of CA
activity in the olfactory epithelium. - Maximum EOG responses occurred around 20-30 CO2
for all the mouse strains. This is slightly
higher than the EOG response maximum (15 CO2)
reported for rats. - NMPs could be recorded from the respiratory
epithelium even though CA activity was not found
in these regions. - NMPs were smaller in amplitude and had a slower
rise time than EOGs recorded in response to CO2. - NMPs could be recorded to CO2 as low as 5
indicating a possible overlap in the sensitivity
of olfactory receptor neurons and trigeminal
nerve endings to CO2. - There appears to be differences in the EOG and
NMP responses to CO2 that is dependent on the
mouse strain.
Figure 1 Carbonic anhydrase activity in mouse
nasal cavity
Figure 3 CO2 responses from (A) olfactory and
(B) respiratory epithelia
CA activity in rat nasal cavity(from Coates
2001)
For this mouse EOGs from the olfactory epithelium
were recorded in response to CO2 as low as 0.5
and reached a response maximum around 30
CO2. Compared to the EOG responses to CO2, the
NMPs recorded from the respiratory epithelium
were smaller in amplitude, had a slower rise
time, and did not appear to reach a response
maximum with 48 CO2.
A and C show the location of the photomicrographs
in B and D. Figure 1B shows two olfactory
neurons (arrows) that exhibit CA activity in a
region of the olfactory epithelium defined as
having low CA activity. Figure 1D and E show
regions of the olfactory epithelium that exhibit
a high density of CA positive olfactory
neurons. For a relative comparison to the mouse,
photomicrographs of CA activity in the rat nasal
cavity are show above.
REFERENCES
METHODS
Figure 4 Average EOG and NMP responses to CO2
in three mouse strains
Figure 2 Schematic drawings of cross-sections
of the mouse nasal cavity.
Histology Experiments Adult male outbred mice
(CF1 Charles River) were deeply anesthetized
with Ketamine (70mg/kg B.W.) and perfused with
PBS followed by 4 glutaraldehyde. Nasal
Cavities were prepared, sectioned, and stained
for carbonic anhydrase (CA) activity according to
previously described methods (4,9). Electrophysio
logy Experiments Adult male outbred mice
(CD1,CFW, CF1 Charles River) were euthanized
with pentobarbital (100mg/kg B.W.) and the nasal
epithelium was exposed according to methods
described by Scott et al. (12). EOGs and NMPs
were recorded from regions of the olfactory and
respiratory epithelium using electrodes (tip
diameter 7-10 ?m) filled with mammalian
ringers solution. CO2 (0-50) and odorants were
delivered through a multi-barrel delivery system.
CO2 concentrations were monitored with an
infrared CO2 analyzer (BCI).
- Coates, E.L., G.O. Ballam, 1989. Effect of UA CO2
pattern on ventilatory frequency in the tegu
lizard. Am. J. Physiol. 257, R156-R161. - Coates, E.L., A. Li, and E.E. Nattie, 1991.
Acetazolamide on the ventral medulla of the cat
increases phrenic output and delays the
ventilatory response to CO2. J. Physiol. 411,
433-451. - Coates, E.L., S.L. Knuth, and D. Bartlett Jr.,
1996. Laryngeal CO2 receptors Influence of
systemic PCO2 and carbonic anhydrase inhibition.
Respir. Physiol. 104, 53-61. - Coates, E.L., C.M.Q. Wells, R.P. Smith, 1998.
Identification of carbonic anhydrase in bullfrog
olfactory receptor neurons Histochemical
localization and role in CO2 chemoreception.
J.Comp. Physiol. (A) 182, 163-174. - Coates, E.L., M.L. Silvis, 1999. Age-related
changes in the ventilatory response to inspired
CO2 in neonatal rats. Respir. Physiol. 118,
173-179. - Coates, E.L. (2001) Olfactory CO2
chemoreceptors. Respiration Physiology.
129(1-2)219-229 - Getchell, T.V., G.M. Shepherd, 1978. Responses of
olfactory receptor cells to step pulses of odour
at different concentrations in the salamander. J.
Physiol. 282, 521-540. - Hanson, M.A., P.C.G. Nye, and R.W. Torrance,
1981. The location of carbonic anhydrase in
relation to the blood-brain barrier at the
medullary chemoreceptors of the cat. J. Physiol.
320, 113-125. - Hansson, H.P.J., 1967. Histochemical
demonstration of carbonic anhydrase activity.
Histochem. 11, 112-128. - Iturriaga, R., A. Mokashi and S. Lahiri, 1993.
Dynamics of carotid body responses in vitro in
the presence of CO2-HCO3- role of carbonic
anhydrase. J. Appl. Physiol. 75, 1587-1594.
EOG responses to CO2 in rats (from Coates 2001)
A. EOG responses to CO2 at a single site in the
olfactory epithelium of the rat. B. Average EOG
response amplitudes in seven rats. C. Locations
of recordings sites.
Individual panels represent caudal positions (in
mm) relative to the start of the vomeronasal
groove (panel A). Endoturbinates are labeled I,
II, II, III, and IV while ectoturbinates are
labeled 1, 2, 2, and 3. VOM vomeronasal organ
and OB olfactory bulb. The highest density of
CA staining was sparse compared to that found in
the rat (Coates, 2001). Like the rat, the highest
density of CA staining was found in dorsal and
caudal regions (E-H). Likewise no CA activity
was found in the vomeronasal organ. In contrast
to the rat, CA activity was found in some
anterior regions of the mouse nasal cavity (A).
EOGs recorded from the olfactory epithelium had
an average response maximum around 20-30 CO2 for
all the mouse strains. This is higher than the
EOG response maximum (15 CO2) reported for
rats The CF1 and CFW mouse strains did not
exhibit an NMP response to CO2 recorded from the
respiratory epithelium that was much higher than
the response to control air (0 CO2). The CD1
mice exhibited an increase in the NMP response to
CO2 that was similar to the EOG dose-response
recorded in the olfactory epithelium.
Recommended
